3200 · International shares
A bargain or a value trap.
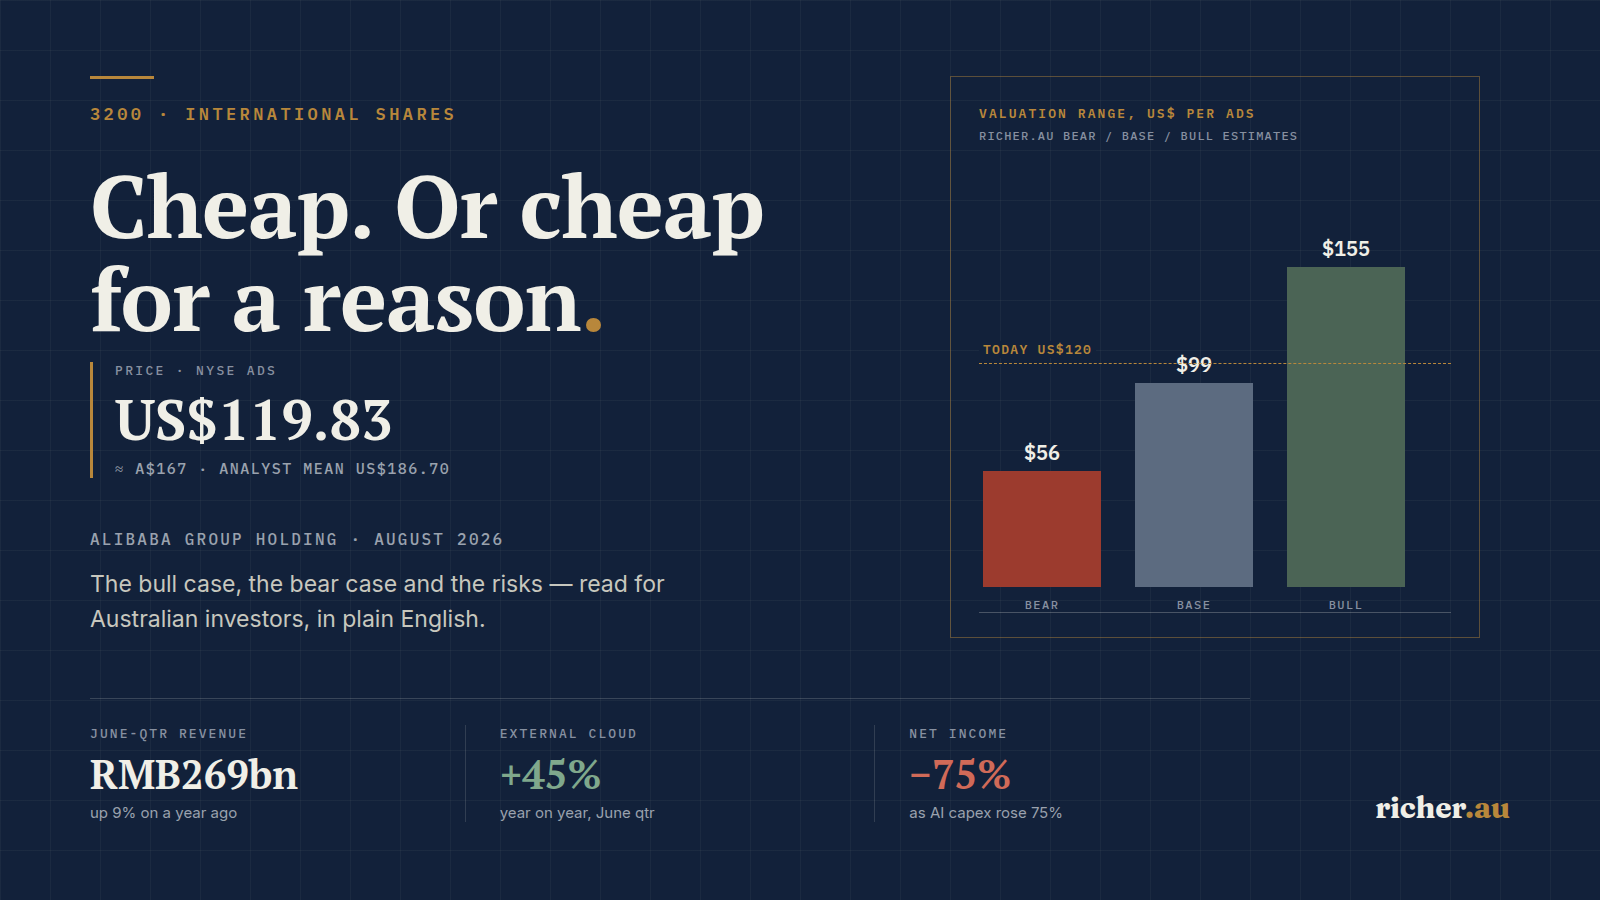
Alibaba’s US-listed shares closed near US$120 while analysts average around US$187. This guide weighs the bull case, the bear case, the valuation and the risks for Australian investors.
What an Australian investor is actually buying
Alibaba is not a single business. It spans Chinese e-commerce (Taobao and Tmall), international commerce (AliExpress, Trendyol, Lazada), a fast-growing cloud and artificial-intelligence division, logistics (Cainiao), local services and a portfolio of digital-media and investment assets.
Most Australians buy Alibaba as an American Depositary Share (ADS) under the ticker BABA. One ADS represents eight ordinary shares. The same ordinary shares also trade in Hong Kong under code 9988, priced in Hong Kong dollars.
The bull case
The bull case rests on three pillars: a cheap valuation, a cloud and AI business compounding quickly, and management returning capital while insiders buy.
On valuation, the June 2026 quarter (three months to 30 June 2026, released 20 August 2026) showed group revenue of RMB268,953 million, up 9% year on year, against cash and equivalents of RMB474,505 million.
On growth, cloud is the standout. Cloud revenue reached RMB48,437 million, with external cloud revenue up 45%. AI-related product revenue was RMB12,376 million and, per the company, recorded its twelfth consecutive quarter of triple-digit percentage growth.
On conviction, the company bought back 13.4 million ordinary shares (~1.7 million ADSs) for about US$162 million in the quarter. Reporting in late August 2026 also indicated co-founder Jack Ma and chairman Joe Tsai made fresh purchases on 24–25 August 2026.
The bear case
The same quarter exposed why the shares are cheap. Operating income fell 57% to RMB15,161 million, adjusted EBITA fell 30% to RMB27,329 million, and net income fell 75% to RMB10,444 million.
The cause is spending. Capital expenditure was RMB67,678 million, up 75% year on year, turning cash generation negative: a free cash outflow of RMB44,670 million for the quarter. A former cash machine is now burning cash on an AI build-out whose returns are unproven — on top of the enduring Chinese-ADR risks of regulation, the VIE structure and listing tensions.
Is the valuation gap versus analyst targets genuine undervaluation, or is the market pricing in risks that deserve the discount?
Valuation: bear, base and bull
Where the multiples sit today
Before modelling scenarios, it helps to see what the market is actually charging for Alibaba right now. The table below is a snapshot of the headline ratios on the 26 August 2026 close of US$119.83 per ADS, on trailing-twelve-month accounts that already include the profit collapse described above.
| Measure | BABA today | What it tells you |
|---|---|---|
| P/E (trailing) | 27.1× | Flattered upward by depressed earnings — EPS of US$4.38 per ADS over the past year |
| P/E (forward) | 19.6× | Assumes consensus is right about a profit recovery in FY2027 |
| PEG ratio | 0.44–0.71 | Below 1 on both common growth estimates, which screens as cheap for the growth |
| Price / book | 1.83× | Book value roughly US$66 per ADS; equity of US$164bn |
| Price / sales | 1.85× | Revenue of about US$154bn (RMB1.04tn) over twelve months |
| EV / EBITDA | 15.2× | Enterprise value about US$262bn after netting cash against debt |
| EV / sales | 1.68× | Cheaper than the equity multiple because the group is net cash |
| Price / free cash flow | n/a | Free cash flow is negative (−US$11.4bn) on capex of US$23.1bn |
| Dividend yield | 0.88% | US$1.05 per ADS a year, a payout ratio near 24% — income is not the reason to own this |
| Earnings yield | 3.95% | The inverse of the trailing P/E; below Australian term-deposit rates |
| Buyback / shareholder yield | −0.39% / 0.48% | New share issuance has more than cancelled out the buyback |
| Return on equity / ROIC | 6.36% / 3.08% | ROIC sits below the roughly 6.5% cost of capital, so today’s spending is not yet creating value |
| Net cash per ADS | US$7.69 | Cash of US$56.8bn less total debt of US$39.2bn; the scenarios below instead use gross cash and equivalents |
| Beta (5 year) | 0.51 | Historically less volatile than the broad US market, which is not the same as low risk |
| 52-week price change | −3.63% | 50-day average US$114.75 against a 200-day average of US$137.07 |
Because current free cash flow is negative from the capex surge, a simple cash-flow multiple is misleading. The scenarios below apply a price-to-earnings multiple to a normalised annual net-profit estimate, then add roughly half of net cash per ADS (about US$28). Figures are per ADS on an estimated post-placement count of ~2,504 million and are richer.au’s own assumptions, not forecasts.
| Scenario | Key assumptions | Value / ADS | vs US$120 |
|---|---|---|---|
| Bear | Net profit ~RMB80bn; P/E 9; AI spend fails to pay off | ~US$56 | −53% |
| Base | Net profit ~RMB120bn; P/E 12; margins stabilise | ~US$99 | −18% |
| Bull | Net profit ~RMB150bn; P/E 16; AI and cloud re-rate the group | ~US$155 | +30% |
Two observations. Even the bull case (~US$155) sits below the 39-analyst consensus mean of ~US$186.70 — a price target is an opinion about where a share might trade, not evidence it will. And the base case sits below today’s price, so the market is already paying for a recovery in profitability.
A net-present-value cross-check
Multiples are shorthand. A discounted cash-flow model asks the more direct question: what are Alibaba’s future cash flows worth today? The problem is that free cash flow is currently negative, so any DCF has to model a recovery. The illustration below assumes the AI build-out peaks and then normalises — free cash flow of about −US$8bn in FY2027, +US$2bn in FY2028, +US$12bn in FY2029 and US$18bn in FY2030, growing 6% a year to FY2036, then a terminal value. Net cash of US$17.5bn is added and the total is divided across roughly 2,281 million ADSs.
| Discount rate | Terminal growth | NPV / ADS | vs US$120 |
|---|---|---|---|
| 9.0% — modest risk premium | 2.5% | ~US$120 | 0% |
| 10.5% — mid-range | 2.5% | ~US$95 | −21% |
| 12.0% — full China-ADR premium | 2.0% | ~US$76 | −37% |
The reverse reading is the useful one. At US$120 the market is implicitly discounting that recovery path at around 9% — above the roughly 6.5% weighted average cost of capital that screens report for Alibaba, but not a large premium for a Cayman-incorporated holding company whose mainland earnings reach you through VIE contracts. Insist on 12% for that risk and the shares are worth closer to US$76. Note also how much of the value sits in the terminal value rather than the next decade of cash: at 10.5% about 61% of the enterprise value comes from cash flows beyond FY2036, which is a long way to look for a business rebuilding its margins.
The August 2026 capital raising
On 26 August 2026 Alibaba placed 710,000,000 new shares at HK$112.70, raising ~HK$80 billion for AI — about 60% (HK$47,871 million) for cloud infrastructure and 40% (HK$31,914 million) for data centres. That is roughly a 3.5–3.7% increase in shares on issue, diluting existing holders by a similar amount. Raising capital can strengthen the AI case, but it sits awkwardly beside a buyback, and the placement price (~US$115 per ADS-equivalent) is a data point, not a valuation anchor.
The verdict, and the Australian angle
Is Alibaba a buy at US$120? On the evidence, it is a qualified hold rather than an obvious bargain. The valuation gap is real, but so is its cause: profits have fallen sharply as spending climbs on an AI build-out whose payoff is years away. This suits a patient investor who understands ADR and VIE risks and can tolerate volatility — not someone seeking near-term certainty. The thesis breaks if cloud growth stalls while capex stays high, or if regulatory or listing risk crystallises. Monitor external cloud growth, capex versus free cash flow, and any change to the VIE or US-listing status.
Australians typically buy BABA through an international share broker. On 27 August 2026 rates were about AUD/USD 0.7186 and AUD/HKD 5.6296 — so a US$120 ADS cost roughly A$167. On tax, dividends and capital gains on foreign shares are generally assessable to Australian residents; US dividends usually attract US withholding tax (reduced via a W-8BEN); a foreign income tax offset may be available. Verify your position with the ATO and a registered tax agent.
Key numbers
What would change the thesis?
- External cloud revenue growth slows materially below recent rates.
- Capex stays elevated while free cash flow remains negative for several quarters.
- Regulatory action, a VIE-structure change, or US-listing pressure crystallises.
- Normalised profitability recovers toward the base/bull assumptions (thesis strengthens).
James Zhang is an Australian investor and business owner, and the founder of richer.au. He holds a Bachelor of Economics from the University of Sydney and an MBA majoring in Finance from the University of Technology Sydney, and has spent over twenty years investing in more than twenty properties across six Australian states and territories, alongside shares, ETFs, commodities and private businesses. More about James.
General information only. Richer Online Pty Ltd does not hold an Australian Financial Services Licence and does not provide personal financial advice. This article does not take your objectives, financial situation or needs into account. Past performance is not a reliable indicator of future performance. Consider your circumstances and seek licensed financial and tax advice before investing.
Get richer, one decision at a time
New articles as they land.
Property, shares, commodities and tax strategy — worked examples with real Australian figures and no product spruiking. One email when something new goes live.
No spam · unsubscribe any time