3100 · Precious metals
Silver tripled. Then it halved.
In six months silver went from US$40 to US$121 and back to the sixties. Behind the noise sits a metal that is half money, half industrial input, pays nothing to hold, and costs an Australian more than the spot price suggests. This guide to silver investment in Australia lays out the numbers, the risks and the practical ways to buy.
Six months that explain the whole asset
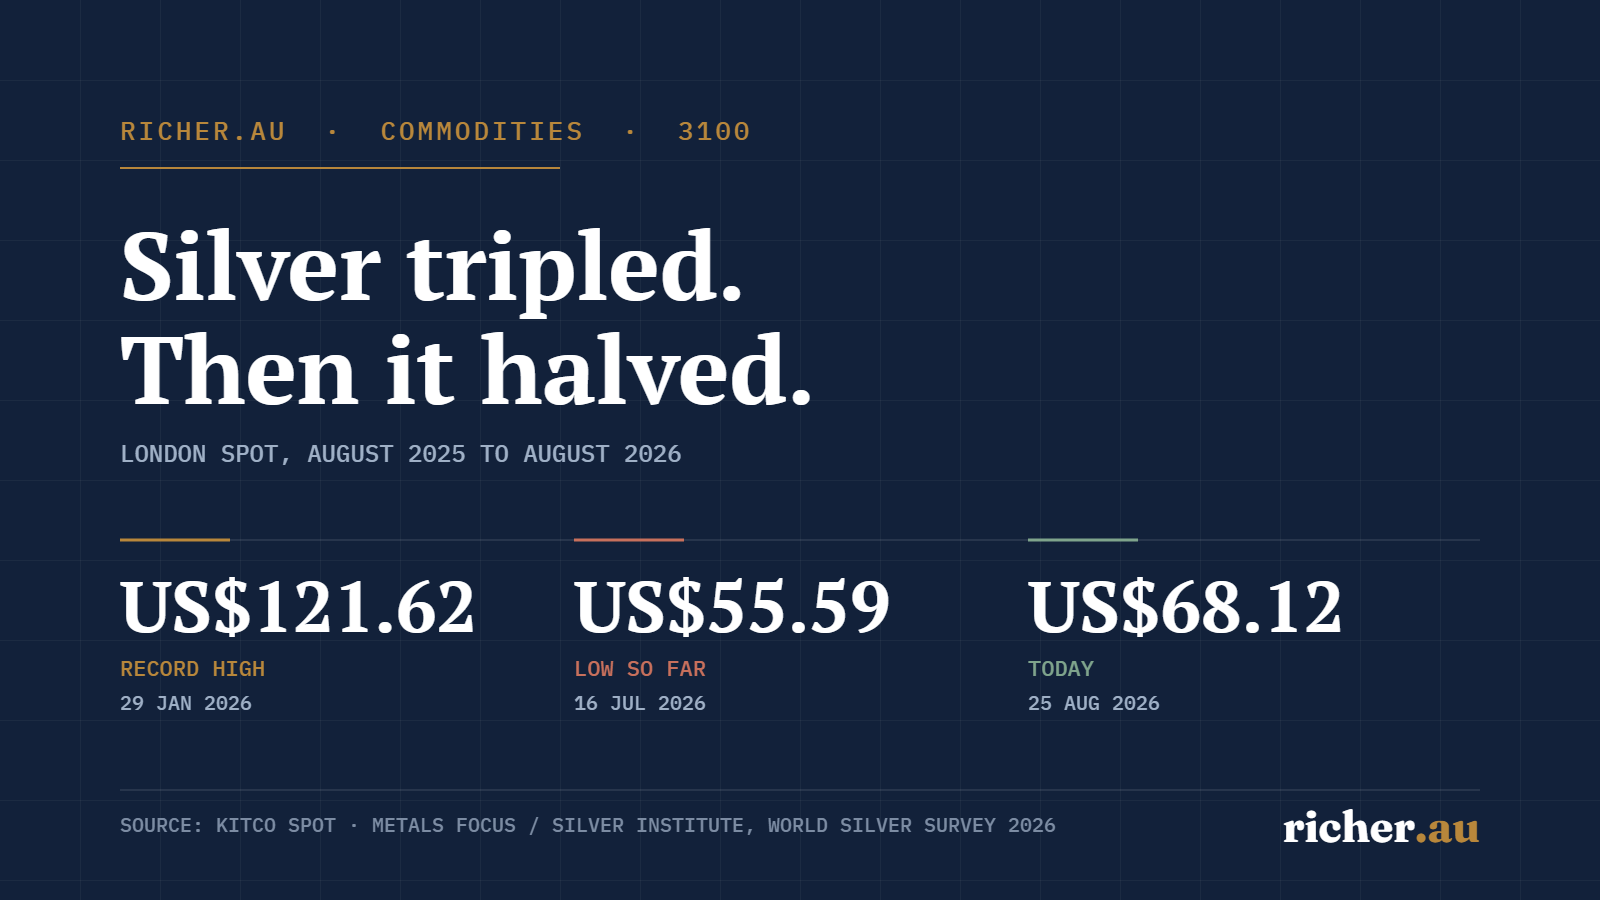
On 29 January 2026 silver traded above US$121 an ounce — an all-time high, and roughly three times where it sat the previous August. Within about thirty hours it had fallen close to US$75. By mid-July it was US$55.59. As at 25 August 2026 it is US$68.12, still 44% below the January peak and up about 71% on a year ago.
That single sequence tells you more about silver than any long definition. It is the only major asset that is simultaneously a monetary metal and an industrial feedstock — melted into solar cells, brazing alloys, switchgear and circuit boards, and also stacked in vaults by people who do not trust paper money. Those two audiences do not always want it at the same time, which is why silver can move like a currency for a year and then like a cyclical commodity for a month.
Three things are worth fixing in your mind before any of the rest of this article makes sense. Silver pays you nothing — no rent, no dividend, no coupon. It therefore has no discounted cash-flow valuation; there is no "fair value" you can calculate from its earnings, because it has none. And it is quoted internationally in US dollars per troy ounce, so an Australian who buys it takes on the silver price and the AUD/USD exchange rate at the same time.
Which leads to the only question that matters: what would have to happen for silver to beat the other assets competing for the same dollar in your portfolio, starting from today's price?
Data updated 25 August 2026. Sources: Kitco spot; RBA daily exchange rates; Metals Focus and The Silver Institute, World Silver Survey 2026; LBMA London vault holdings, July 2026. Full source list at the end of this article.
What actually sets the silver price
Silver has three sets of buyers and one set of sellers, and they answer to completely different signals. Untangling them is the whole job.
Investment demand: the monetary half
This is the part that behaves like gold. It responds to real interest rates (the cash rate minus inflation), inflation expectations, financial stress, geopolitical risk and the US dollar. When money in the bank earns you a solid real return, a metal that earns nothing looks expensive to hold; when real rates fall, that opportunity cost shrinks and precious metals tend to do better.
Right now the arithmetic is not especially friendly. The RBA held the cash rate at 4.35% on 11 August 2026 against annual CPI of 3.8% to June — a positive but slim real return on cash. Investment demand is also the most reflexive component: exchange-traded product holdings and bar-and-coin buying rise because the price is rising, and reverse just as quickly. Coin and bar demand rose 14% in 2025 while the price nearly doubled. That is momentum, not a floor.
Industrial demand: the half gold doesn't have
Roughly 58% of all silver demand in 2025 was industrial — 657.4 Moz out of 1.13 Boz. Silver is the best electrical and thermal conductor of any element, which is why it turns up in solar cell metallisation pastes, electrical contacts and switchgear, brazing alloys, printed circuit boards, connectors in vehicles, aerospace components, antibacterial medical coatings and, increasingly, in the electrical infrastructure feeding data centres.
Here is where a lot of silver commentary goes wrong. The bullish story usually runs: solar keeps growing, therefore silver demand keeps growing. The most recent data says otherwise. Photovoltaic silver demand fell 6% in 2025 to 186.6 Moz and Metals Focus forecasts it will fall a further 19% in 2026, to about 151 Moz — while global solar installations keep rising.
The reason is thrifting and substitution. Thrifting means using less silver to do the same job — thinner paste lines, finer screen printing, better cell design. Substitution means replacing it, mostly with copper-based metallisation on the back of the cell. Both accelerate when the silver price spikes, because the metal suddenly becomes a large share of a solar manufacturer's bill of materials in a brutally competitive industry. A high price is not just a reward for holders; it is an instruction to engineers to design the metal out.
That is the uncomfortable feedback loop at the heart of the industrial bull case: the higher silver goes, the harder its biggest growth market works to need less of it. It does not make the industrial story wrong — electrification, grid investment and data-centre power infrastructure are real. It does mean "solar demand will keep rising" is an assumption, not a fact, and the latest data does not support it.
Supply: why a high price doesn't summon more metal
About three-quarters of the world's mined silver is a by-product — it comes out of lead, zinc, copper and gold mines whose production decisions are driven by the economics of those metals, not silver. That is the single most important structural fact about silver supply, and it cuts both ways.
On the bullish side, it means a silver price spike does not trigger a wave of new supply the way it would in a commodity dominated by dedicated mines. Nobody opens a copper mine because silver went up. On the bearish side, it also means supply does not fall when silver falls — the zinc mine keeps producing silver regardless. Mine production still rose 3% to 846.6 Moz in 2025 and is forecast to be broadly flat in 2026.
Recycling is the other release valve, and it is price-sensitive in a way mining is not. Scrap supply reached 197.6 Moz in 2025, a 12-year high, and Metals Focus expects it to pass 200 Moz in 2026 for the first time since 2012. When silver triples, jewellery boxes and industrial scrap heaps empty out.
Is the world actually running out of silver?
You will read a great deal about the silver "deficit". It is real, it is documented, and it is almost always described in a way that is more dramatic than the numbers deserve. Worth pulling apart carefully.
A market deficit means that in a given year, identified demand exceeded identified new supply from mines and recycling. It does not mean silver disappeared, and it does not mean anybody went without. The gap is filled from above-ground stocks — metal that already exists in vaults, exchange warehouses and existing holdings, and which changes hands at a price.
The 2025 figure was a deficit of 40.3 Moz, the fifth consecutive annual shortfall, forecast to widen to 46.3 Moz in 2026. Set that against the scale of the market: 40.3 Moz is about 3.6% of one year's demand. And set it against the stockpile — in July 2026 the LBMA reported 28,213 tonnes of silver sitting in London vaults alone, roughly 907 million ounces across about 940,000 bars. London is not the only vault system; COMEX, Shanghai and exchange-traded product holdings hold more.
It does mean above-ground stocks are being drawn down, and that all else equal the market is tightening. Six consecutive years of it is a genuine signal, not noise.
It does not mean a physical shortage. A deficit of 40 Moz against roughly 900 Moz in London alone can run for many years before anything breaks — which is precisely what has happened.
Note also that the headline "market balance" published in the World Silver Survey is struck before exchange-traded product flows. In a year when ETP holdings rise sharply, far more metal is being absorbed than the balance figure alone suggests — and in a year they fall, metal comes back out. That is one reason the deficit number and the price do not move together.
There was a genuine squeeze in October 2025 — falling free-float inventories, a rapid shift of metal into CME vaults, rising ETP holdings and a surge in bar and coin buying combined to produce what Metals Focus called an unprecedented liquidity squeeze, with lease rates spiking. That is the mechanism to watch. It was a location and availability problem, not a global exhaustion of silver.
If a real physical shortage is developing, these are the things that would show it: sustained high silver lease rates; London and COMEX registered stocks falling persistently rather than merely rotating between vaults; backwardation in the futures curve holding for months rather than days; and industrial users publicly reporting they cannot secure metal. Watch those, not the deficit headline.
The bull case, the bear case, and what is already priced
The strongest case for silver
Built properly, it goes like this. Mine supply is structurally unresponsive because three-quarters of it is a by-product, and it grew only 3% in a year when the price nearly doubled. Six consecutive annual deficits have drawn down free-float inventories to the point where a liquidity squeeze already happened once. Electrification is a genuine multi-decade demand source: grid replacement and expansion, data-centre electrical infrastructure, vehicle electronics and connectors, and industrial electronics all consume silver in applications where substitution is harder than it is in solar paste.
On the monetary side, if real interest rates fall from here, the opportunity cost of holding a non-yielding asset drops. Gold at US$4,633 an ounce is already at levels that historically pull retail investors toward silver as the cheaper precious metal, and silver's smaller market means the same dollar of inflow moves the price far more. Physical investment demand is forecast to rise strongly again in 2026.
All of that is defensible. The question is the one investors skip: how much of it is already in the price? Silver averaged US$40.03 in 2025, up 42% on 2024, and finished the calendar year up about 144%. It then tripled from its August 2025 level to the January peak. A market does not do that unless the story is widely known and widely believed. Buying the narrative after the re-rating is a different proposition from buying it before.
The case against
Silver produces no income at all, so every dollar of return has to come from someone paying more later. It is far more volatile than gold and has a history of catastrophic drawdowns, covered below. It is exposed to global manufacturing — a slowdown in China, which dominates solar manufacturing and much of the electronics supply chain, hits more than half of total demand directly.
The specific bear risks worth naming: real interest rates rising rather than falling; a stronger US dollar; PV thrifting and copper substitution continuing to compound, which is already happening; recycling rising further at high prices, which it is; investment demand reversing as fast as it arrived; and the plain opportunity cost of holding a metal instead of a productive asset. Australian shares returned 7.2% a year over 20 years and international shares 9.1%, with dividends — while silver spent the decade from end-2010 to end-2020 going from A$30.15 to A$34.28.
Scarcity does not equal value at any price. Something can be genuinely scarce and still be a poor investment if you pay too much for it.
Silver versus gold
| Factor | Silver | Gold |
|---|---|---|
| Industrial demand | ~58% of demand (657 Moz of 1.13 Boz, 2025) | Small — mostly jewellery, investment and central banks |
| Investment demand | Significant but volatile and momentum-driven | Dominant, including sustained central bank buying |
| Volatility | High — tripled and more than halved within 12 months | High by 2026 standards, but materially lower than silver |
| Market size / liquidity | London vaults ~US$52.7bn (July 2026) | London vaults ~US$1.2tn (July 2026) |
| Storage efficiency | Poor — A$50,000 is roughly 16 kg of metal | Excellent — the same value is about 240 grams |
| Income | None | None |
| Sensitivity to global growth | High — over half of demand is industrial | Low |
| Safe-haven behaviour | Inconsistent — often sells off first in a liquidity event | More reliable, though not guaranteed |
| Upside in a precious-metals bull market | Typically larger than gold | Steadier |
| Downside risk | −72% (2011–15), −93% (1980–91) | Large, but historically shallower and shorter |
Silver is often described as a higher-beta version of gold, and over precious-metals bull runs that is broadly what happens. But it is not a reliable relationship. In a genuine liquidity crisis silver frequently falls with risk assets while gold rises, because the industrial half of its demand base is behaving like a commodity at exactly the moment the monetary half wants a haven. Anyone buying silver as insurance should understand it is a less dependable policy than gold.
The gold-to-silver ratio
The ratio is simply how many ounces of silver one ounce of gold buys: US$4,633 ÷ US$68.12 = 68 as at 25 August 2026. It reached a record above 125 in March 2020 and its lowest modern level, around 17, at the January 1980 peak.
What the ratio can tell you: whether silver is cheap or expensive relative to gold, against its own history. What it cannot tell you: whether either metal is cheap in absolute terms, or when the relationship will revert. The ratio spent the entire period from 2015 to 2025 above its long-run average — a decade in which "silver is undervalued versus gold" was true on the ratio and unprofitable in practice. At 68 today it is close to its 20-year average, which is to say it is telling you very little. Treat it as context, never as a timing signal.
Why an Australian gets a different return
Silver is quoted internationally in US dollars per troy ounce. The price an Australian actually experiences is:
AUD silver price = USD silver price ÷ AUD/USD exchange rate
US$68.12 ÷ 0.7169 = A$95.02 per ounce as at 25 August 2026, using the RBA's 24 August rate.
That division does a lot of quiet work. When the Australian dollar falls, the AUD silver price rises even if nothing happens in US dollars — and when the Australian dollar rallies, an Australian can watch silver make headlines in New York and see very little in their own account. Four illustrations from today's starting point:
| Scenario | USD silver | AUD/USD | AUD silver | Your return |
|---|---|---|---|---|
| Today | US$68.12 | 0.7169 | A$95.02 | — |
| A · Silver +20%, currency unchanged | US$81.74 | 0.7169 | A$114.02 | +20.0% |
| B · Silver +20%, AUD strengthens to 0.80 | US$81.74 | 0.8000 | A$102.18 | +7.5% |
| C · Silver unchanged, AUD falls to 0.65 | US$68.12 | 0.6500 | A$104.80 | +10.3% |
| D · Silver −20%, AUD falls to 0.65 | US$54.50 | 0.6500 | A$83.85 | −11.8% |
Illustrative arithmetic by richer.au from the 25 August 2026 spot price and the RBA AUD/USD rate. Exchange rate levels chosen to show the mechanism, not as forecasts.
Two practical consequences. First, unhedged silver has historically been a partial Australian-dollar hedge: the AUD tends to weaken when global growth scares hit, which softens the fall in AUD terms — scenario D. Second, it means that when you read that silver is up 15% this year, that number is not yours. Check the currency before you check the metal.
How Australians can actually own silver
A. Physical bullion
Bars and coins, bought from a dealer or mint, held at home or in a vault. It is the only method where you hold the metal itself with no issuer, custodian or counterparty between you and it — which for some buyers is the entire point.
For Australians buying physical metal, two of the most established and trusted sources are ABC Bullion and the Perth Mint. Where possible, favour minted silver — minted coins and minted bars — over cast bars: the recognised branding and finish generally command a higher resale value when you sell. It also helps to buy in troy ounces (oz) rather than grams or kilograms, since the global spot price is quoted per ounce, which makes it far easier to check what you are paying against the live market and to calculate your premium.
It is also, by a wide margin, the most expensive way to own silver. You do not pay the spot price. You pay spot plus a fabrication and dealer premium, and you sell at a discount to spot. On 25 August 2026, with spot around A$95.10, one large Australian dealer quoted a 1 kg 99.9% cast bar at A$3,339.40 against a spot metal value of A$3,057.53 — a premium of 9.2% — and offered to buy the same bar back at A$2,915.58, a discount of 4.6%. That is a round trip of about 12.7% before you have moved an inch. Coins are worse: a 1 oz Silver Kangaroo carried a 13.8% premium, and a 1 oz American Silver Eagle 22%.
Note that the same dealer's buyback was a flat price for any 1 kg bar and any 1 oz coin. The brand premium you pay on the way in is not returned on the way out. Across three major Australian dealers the realistic round trip on 25 August 2026 was 11–19% for 1 kg cast bars and 16–22% for 1 oz coins. Larger bars are meaningfully cheaper per ounce than small coins in both directions.
Then there is bulk. A$50,000 of silver is roughly 16 kilograms of metal — the same value in gold is about 240 grams. Home storage means a safe and an insurance conversation; vault storage means an annual fee. The Perth Mint, a statutory authority of the Western Australian Government whose client holdings carry a WA Government guarantee, charges (all GST inclusive, as at 25 August 2026): 1.90% p.a. for allocated silver, 0.95% p.a. for pool allocated, and nil for unallocated, with a A$5,000 minimum transaction. At 1.90% on metal worth about A$95 an ounce, allocated storage costs roughly A$1.81 per ounce per year — a serious drag on a non-income asset.
"Silver is GST free" is not what the law says. Under the GST Act, precious metal means silver of at least 99.9% fineness and in investment form. The ATO's ruling GSTR 2003/10 sets three cumulative tests for investment form: the item must be capable of being traded on the international bullion market; bear a mark or characteristic accepted as identifying and guaranteeing its fineness; and usually be traded at a price determined by reference to the spot price.
Investment-grade bars and standard bullion coins meet all three, and their supply is input taxed — no GST in the price. Items that fail the tests are taxable supplies and carry GST: jewellery, sterling or "junk" silver below 99.9%, numismatic coins priced for rarity, and proof coins, which are priced above spot for their finish. A proof coin is not a cheaper way to own silver with a nicer box; it is a GST-bearing collectable.
B. ASX-listed physical silver
Global X Physical Silver (ASX: ETPMAG) is the main listed route, and it is worth being precise about what it is, because it is commonly and incorrectly called an ETF. It is not a managed fund. Each security is a redeemable preference share in Global X Metal Securities Australia Limited, bundled with a beneficial interest in a separate trust that holds the corresponding bullion. It is offered under a prospectus rather than a PDS, and issued under the ASX structured-product framework.
The metal is physically held and allocated — specific bars, individually identified — with JPMorgan Chase Bank, N.A. as custodian, vaulted in London. The management fee is 0.49% p.a., taken by reducing the metal entitlement attaching to each security a little every day, so the ounces behind your holding shrink slowly over time rather than a fee being billed. There are no distributions. Funds under management were A$1.53 billion with a NAV of A$88.998 per security as at 21 August 2026.
It is unhedged: the bullion is priced in US dollars, the security trades in Australian dollars on the ASX, so you carry the full AUD/USD exposure described above. One structural quirk worth knowing: silver imported into the UK attracts 20% VAT, and while the issuer bears that within the vault system, a holder who redeems for physical delivery outside it becomes liable for the VAT. In practice ETPMAG is a way to own the silver price, not a route to metal in your hand.
Two related products exist. ETPMPM (Global X Physical Precious Metals Basket, 0.44% p.a.) held 26.4% silver alongside gold, platinum and palladium as at 21 August 2026 — a diluted way to get silver. SLVM (Global X Silver Miners ETF, 0.65% p.a., launched 27 January 2026) is a genuine ETF, but it holds mining equities, not metal. There is currently no ASX-quoted futures-based or currency-hedged silver product.
C. Silver miners
Owning a silver miner is not owning silver. You are buying a business with operating leverage, energy and labour costs, declining ore grades, capital expenditure programs, debt, management quality, jurisdiction risk and dilution risk on top of the metal price. Miners can rise far more than silver in a bull market — and fall in a year when silver rises, because a mine flooded or a permit was refused.
The bigger trap is the label. Very few companies with "silver" in the name actually earn most of their revenue from silver:
| Company | Silver share of revenue | Period |
|---|---|---|
| Hecla Mining (NYSE: HL) | 64% | Q2 2026 |
| First Majestic Silver (NYSE: AG) | 60% | Q2 2026 |
| Wheaton Precious Metals (NYSE: WPM) — a streamer, not a miner | 52% | Q2 2026 |
| Fresnillo plc (LSE: FRES) | 46.5% | FY2025 |
| Pan American Silver (NASDAQ: PAAS) | ~31% — about 65% of revenue is gold | Q2 2026, derived |
| Coeur Mining (NYSE: CDE) | 30% — 64% is gold | Q2 2026 |
| DPM Metals (ASX: DPM, CDIs) | ~20% — about 67% is gold | Q2 2026 |
Company quarterly and annual reports; the Pan American figure is derived by richer.au from disclosed ounces sold and realised prices because the company does not publish a revenue-by-metal table. Named as examples of how to check the revenue split — not as recommendations, and not a suggestion that any of them is suitable for you.
On the ASX specifically, there is currently no listed producer whose revenue is majority silver. Silver Mines (SVL), Investigator Silver (IVR), Boab Metals (BML), Andean Silver (ASL), Unico Silver (USL) and Sun Silver (SS1) are all pre-revenue explorers or developers — a different risk category again, closer to venture capital than to a commodity allocation. Boab's own feasibility work splits its project revenue roughly 77% lead and 23% silver. Adriatic Metals (ADT) no longer exists as an ASX line; it was acquired by Dundee Precious Metals in September 2025 and now trades as DPM.
The hidden cost of physical silver
This is where being right about silver and still losing money happens. Work an example. You want A$50,000 of silver exposure and you are choosing between 1 kg cast bars and the listed product. Spot on 25 August 2026 is A$95.10 an ounce, or A$3,057.53 per kilogram.
| A$50,000 of exposure | Physical 1 kg bars | ETPMAG |
|---|---|---|
| What you pay | A$3,339.40/kg — 9.2% over spot | Market price plus brokerage, ~A$10 |
| Metal you end up with | 14.97 kg (481 oz) | Equivalent metal entitlement |
| Metal value at spot on day one | A$45,782 — you are down A$4,218 immediately | ≈ A$49,900 after brokerage and spread |
| Delivery and insurance | ≈ A$31 per order | None |
| Ongoing cost | Nil at home; 0.95–1.90% p.a. vaulted | 0.49% p.a., deducted from the metal entitlement |
| What you get back at unchanged spot | A$43,646 — dealer buyback at 4.6% under spot | ≈ A$48,700 after five years of fees and the exit spread |
| Silver rise needed just to break even | +14.5% | +2.9% over five years |
Roughly twelve percentage points of head start, on day one, for choosing one wrapper over another. That does not make physical wrong — if what you want is metal you can hold with no issuer in the chain, the premium is the price of that feature and you should pay it knowingly. It does mean that anyone buying physical as a cheap way to track the silver price has misunderstood the trade.
Two practical notes. Larger bars carry materially lower premiums than small coins, and brand premiums are not recovered on sale — the dealer above bought back every 1 kg bar at the same flat price regardless of what you paid. And a "collectable" or proof coin is a worse deal again: higher premium, GST on top, and a resale value that depends on finding a collector rather than on the metal.
Australian tax
Plain English, current law, and one large change already legislated. None of this is personal advice, and the classification question below is genuinely unsettled — worth a conversation with a registered tax agent before a large purchase.
Capital gains tax
Silver held as an investment is a CGT asset. Sell it and the gain or loss is the proceeds less the cost base. Your cost base includes what you actually paid — dealer premium included, because that is money paid for the asset — plus incidental costs such as brokerage. Insurance premiums can also be added under the third element of the cost base if you acquired the asset after 20 August 1991 and the cost is not otherwise deductible. Vault storage fees arguably belong there too, though the ATO does not name them specifically.
The CGT discount currently reduces a gain on an asset held at least 12 months by 50% for individuals and trusts, and by 33⅓% for complying super funds. Companies get no discount.
You buy A$20,000 of silver exposure and sell it more than a year later for A$30,000. The A$10,000 gain is reduced by the 50% discount to a A$5,000 net capital gain, which is added to your taxable income and taxed at your marginal rate. On a 37% marginal rate plus Medicare levy that is roughly A$1,975 of tax on a A$10,000 gain. Sell inside 12 months and the whole A$10,000 is assessable.
The Treasury Laws Amendment (Tax Reform No. 1) Act 2026 received assent on 26 June 2026. From 1 July 2027 the 50% CGT discount for individuals, partnerships and trusts is replaced by cost base indexation using CPI, plus a minimum 30% tax rate on real capital gains. The Budget explainer is explicit that this applies to all CGT assets, including shares — so bullion and listed silver products are in scope, not just property.
There is no deemed sale on 1 July 2027. Nothing is crystallised and no tax falls due on that date. When you eventually sell, you either obtain a valuation of the asset as at 1 July 2027 or use a specified apportionment formula, and the pre-2027 and post-2027 portions of the gain are treated differently. Practically: keep a record of the spot price or unit price on 30 June 2027 and you will make that election easy on yourself later.
The published material is not clear on how complying super funds and companies are treated after 1 July 2027 — one Budget document lists companies as within the indexation change while the ATO summary describes the discount replacement as applying to individuals, trusts and partnerships. If you hold silver in an SMSF or a company, get advice rather than assuming the 33⅓% discount survives.
The classification question the internet gets wrong
You will see it stated confidently that investment bullion is an ordinary CGT asset rather than a "collectable". The ATO has published no ruling, determination or guidance saying that. The statutory list of collectables includes "coins or medallions", qualified by being kept mainly for personal use or enjoyment — which is the hook the investment argument hangs on, and it is a reasonable position. But it is untested guidance, and it matters: gains on a collectable acquired for A$500 or less are disregarded, and losses on collectables can only be offset against gains on other collectables. Personal use assets have a A$10,000 threshold and their losses are disregarded entirely.
The listed product avoids the question completely. A unit or security in a listed silver product is not a coin, a medallion or jewellery; it is unambiguously an ordinary CGT asset. That is a real and under-appreciated advantage of the ETP route.
GST and trading
Covered above: investment-form silver of at least 99.9% fineness is input taxed, so there is no GST in the price. Buying a listed silver security is a financial supply — also input taxed, so no GST there either. Sub-fineness, numismatic, proof and jewellery silver are taxable supplies.
Finally, if you buy and sell frequently and in a business-like way, the ATO may treat you as carrying on a business rather than investing — in which case gains are ordinary income, losses are deductible against other income, and no CGT discount applies. The ATO's published guidance on this is written for shares and applies to bullion by analogy. Keep records: acquisition invoices, dates, prices, brokerage and storage costs, kept for five years after the year you sell.
How silver has actually performed
Right now, silver's long-run record looks superb — and that is precisely the problem with quoting it. We are measuring from a point seven months after a historic spike. Here is the honest version, with the caveats attached.
| Annualised return | Silver in A$ | Australian shares | International shares | Cash | CPI |
|---|---|---|---|---|---|
| ~1 year | +56% | 5.7% | 14.9% | 3.9% | 3.9% |
| ~5 years | 26.3% p.a. | 7.4% | 13.4% | 3.1% | 4.4% |
| ~10 years | 16.3% p.a. | 9.5% | 14.0% | 2.2% | 3.1% |
| ~20 years | 10.5% p.a. | 7.2% | 9.1% | 3.3% | 2.7% |
| Calendar decade 2011–2020 | 1.3% p.a. | — | — | — | ≈1.9% |
Silver: computed by richer.au from year-end closes converted to Australian dollars, measured to 25 August 2026 — so the periods are approximate and the starting points are calendar year-ends (2005, 2015, 2021 and 29 August 2025). Comparison assets: 2026 Vanguard Index Chart, annualised total returns with income reinvested to 30 June 2026, before tax and costs — Australian shares are the All Ordinaries Accumulation Index, international shares MSCI World ex-Australia in AUD, cash the Bloomberg AusBond Bank Bill Index. The end dates are not identical and the comparison is indicative only. Silver produces no income; every other column includes it.
Now the caveat that matters more than the table. Change the measurement date by a few weeks and silver's numbers move enormously, because it has no earnings stream to anchor them. Measured to 29 August 2025 — one year ago — silver's 20-year return in Australian dollars was about 8.6% a year, not 10.5%. Measured to the 16 July 2026 low it would be lower again.
And look at the bottom row. Over the ten calendar years from the end of 2010 to the end of 2020, silver went from A$30.15 to A$34.28 an ounce. That is 1.3% a year over a decade, against inflation of roughly 1.9% a year — a real loss, across ten years, in an asset that paid nothing along the way. Australian shares roughly doubled over the same stretch with dividends. That decade is not an anomaly to be explained away; it is what a non-income asset does when the story goes quiet.
Silver's drawdowns are the whole risk
Three episodes tell you what you are buying.
1980. Silver peaked at US$49.45 on 18 January 1980 after the Hunt brothers' corner. By 22 May it was US$10.89 — down 78% in four months. The bear market did not end there: it ground down to US$3.55 by February 1991, a fall of 93% over eleven years. Nominal recovery to the 1980 level took until April 2011, thirty-one years, and did not hold; a durable break above US$50 waited until October 2025 — 45 years. In inflation-adjusted terms the 1980 peak has never been recovered. It is worth roughly US$193 in today's money, well above January 2026's record.
2011. Peak US$48.70 in April, trough US$13.71 in December 2015 — −72% over 4.6 years, with recovery to the old peak taking 14.5 years.
2026. Peak US$121.62 on 29 January. Within about thirty hours it was near US$75 — a 38% fall in a day and a half. The low so far was US$55.59 on 16 July, −54%, and it currently sits 44% below the peak. This one is still in progress.
Two conclusions follow. First, silver is not a cash substitute or a defensive holding, whatever the framing on social media. Second, leverage on silver is a fast way to be right and ruined — a 38% move in thirty hours liquidates a geared position long before the thesis has a chance to play out.
Bull, base and bear: three to five years
Nobody knows the price. What can be done honestly is to write down assumptions, attach probabilities to them, and see what the arithmetic implies. The probabilities below are richer.au's own analytical assumptions. They are not forecasts from the Silver Institute, Metals Focus, the ASX or anybody else, and they should be argued with.
| Scenario | Probability | What would have to happen | Silver, USD/oz | Implied change |
|---|---|---|---|---|
| Bear | 30% | Real rates rise, US dollar strengthens, global manufacturing slows, PV thrifting and copper substitution compound, recycling keeps climbing, investment flows reverse | US$35–50 | −49% to −27% |
| Base | 45% | Industrial demand stabilises near 640–660 Moz as grid and electronics offset falling solar loadings; small deficits persist but remain trivial against above-ground stocks; investment demand steady | US$60–85 | −12% to +25% |
| Bull | 25% | Real rates fall materially, US dollar weakens, mine supply stays flat, free-float inventories keep draining, another liquidity squeeze, investment demand returns at scale. This is the range implied by analyst Michael Oliver's structural bull case | US$300–500 | +340% to +634% |
Take the midpoint of each range — US$42.50, US$72.50 and US$400 — and weight them: (0.30 × 42.50) + (0.45 × 72.50) + (0.25 × 400) = US$145.38. That is about +113% over three to five years from today's US$68.12, or roughly 16–29% a year, in US dollars, before costs, before tax and before whatever the Australian dollar does.
Which is the point of doing the exercise. Even weighting a genuine bull case at one chance in four, the probability-weighted outcome is roughly cash-like — with equity-like volatility and a demonstrated capacity to fall 50% in six months. The distribution is wide and the expected value is modest. That is not an argument against ever owning silver; it is an argument against expecting it to carry a portfolio.
What role, if any, in a portfolio
Nobody needs to own silver. The honest framing is that it may be a useful satellite — a small allocation with return drivers different from the rest of your holdings — rather than a core holding you rely on to compound.
| Allocation | What it does |
|---|---|
| 0% | Entirely defensible. A diversified portfolio of productive assets does not need a commodity sleeve to work. |
| 5% | Enough to matter in a precious-metals bull market, small enough that a 50% fall costs you 2.5% of the portfolio. This is what a diversification allocation looks like. |
| 10% | A deliberate view, not a diversifier. A 50% fall costs 5% of the portfolio; you need conviction and a long horizon. |
A concentrated silver position is a fundamentally different proposition from a 5% sleeve. The first is a bet on a specific outcome within a specific timeframe; the second is a small piece of portfolio insurance whose cost is the return you forgo elsewhere. Confusing the two is how people end up holding a metal they never intended to own for a decade.
Silver versus simply owning productive assets
The uncomfortable question, and richer.au is going to ask it plainly. If silver produces no income, why own it instead of a business, an ETF or a property that generates cash?
A kilogram of silver will still be a kilogram of silver in twenty years. It cannot reinvest, cannot raise prices, cannot expand into a new market. For it to produce a return, somebody else must eventually pay a higher real price for the same lump of metal. A profitable company, by contrast, compounds internally: it earns, reinvests some of those earnings at a return, and grows the earnings base you own. That is why Australian shares returned 7.2% a year over twenty years and cash returned 3.3% — the difference is compounding, not luck.
That does not make silver useless. Its role is not compounding; it is being uncorrelated at the right moment. An asset that behaves differently when your shares and property are falling together has value even with an expected return below equities, because it may let you rebalance instead of sell. But be clear which job you are hiring it for. Buying silver expecting equity-like compounding is a category error.
Who it might suit, and who it probably doesn't
Without offering personal advice, the patterns are reasonably clear.
Investors who already hold diversified productive assets and want a modest allocation with different return drivers. People who are genuinely comfortable watching a holding halve without selling. Investors who have done the cost arithmetic above and chosen the wrapper deliberately. Anyone specifically seeking exposure to a falling Australian dollar alongside a metal price.
Anyone who needs income — silver pays nothing, ever. Short-horizon investors who cannot tolerate a 50% drawdown. Anyone putting a large share of their wealth into one commodity. Anyone buying because of a social-media claim that a shortage is imminent — the deficit is real, the shortage claim is not supported by 907 million ounces sitting in London vaults. And anyone who has not compared premiums, spreads, storage and fees, because on physical metal those alone can cost 12–19% of a round trip.
The conclusion
Silver has a credible investment case. Mine supply is structurally slow to respond because most of it is a by-product; industrial applications are real and broad; and it retains a monetary role that can become valuable in periods of financial stress. Six consecutive annual deficits and an actual liquidity squeeze in October 2025 are not nothing.
It is also a volatile, non-income-producing commodity that has spent decades below previous peaks, whose largest growth market is actively engineering it out, and whose price already tripled before most people started paying attention. For an Australian the decision is complicated further by the exchange rate, by tax rules that change on 1 July 2027, and by a cost of ownership that ranges from 0.49% a year to a 14.5% hole on day one depending purely on the wrapper you choose.
So the question is not whether silver will rise. It probably will, in some years, by a lot. The question is the one that applies to every asset:
Will silver produce a better risk-adjusted return from today's price than the other assets competing for the same dollar in your portfolio?
Answer that honestly, size the position accordingly, and pick the cheapest wrapper that gives you the exposure you actually want.
Frequently asked questions
Is silver a good investment in Australia in 2026?
Silver has a credible case — mine supply is slow to respond because most of it is a by-product, industrial demand is broad, and it holds a monetary role in periods of stress. But it pays no income, it is highly volatile, and it already tripled between August 2025 and January 2026 before falling 44%. Whether it is a good investment depends entirely on the price you pay and what else that money could buy.
How do I buy silver in Australia?
Three main routes. Physical bars and coins from a dealer or the Perth Mint, which you store yourself or in a vault. A listed product such as Global X Physical Silver (ASX: ETPMAG), bought through an ordinary brokerage account, which holds allocated bullion in London for a 0.49% annual fee. Or silver mining shares, which are businesses rather than metal and behave differently from the silver price.
Do you pay GST on silver in Australia?
Not on investment-grade silver. Under the GST Act, precious metal means silver of at least 99.9% fineness and in investment form — capable of being traded on the international bullion market, bearing an accepted mark of fineness, and usually traded at a price set by reference to spot. Bars and standard bullion coins meet those tests and their supply is input taxed, so there is no GST in the price. Jewellery, sterling silver, numismatic coins and proof coins fail the tests and are taxable supplies.
How is silver taxed in Australia?
Silver held as an investment is a CGT asset. Gains are currently reduced by the 50% CGT discount for individuals and trusts if held at least 12 months, or 33⅓% for complying super funds; companies get no discount. From 1 July 2027 legislated changes replace the 50% discount for individuals, partnerships and trusts with CPI cost-base indexation plus a minimum 30% tax rate on real gains accruing after that date. There is no deemed sale on 1 July 2027 — the split is worked out when you actually sell.
Is silver better than gold?
They do different jobs. Silver has more industrial demand — about 58% of consumption in 2025 — which makes it more sensitive to global growth and far more volatile. Gold is the more reliable safe haven and is vastly easier to store, since A$50,000 of silver is roughly 16 kilograms of metal. Silver typically rises more than gold in precious-metals bull markets and falls harder afterwards.
What is the gold-to-silver ratio and does it mean silver is cheap?
It is how many ounces of silver one ounce of gold buys — about 68 as at 25 August 2026, against a 1971–2025 average near 60 and a 20-year average near 70. It tells you whether silver is cheap relative to gold, not whether either is cheap in absolute terms, and it has no useful record as a timing signal. The ratio sat above its long-run average for most of 2015 to 2025, a period in which acting on it would not have paid.
Is the world running out of silver?
No. The market has run a deficit for five consecutive years — 40.3 million ounces in 2025, forecast to widen to 46.3 Moz in 2026 — which means demand exceeded new mine and recycled supply and the gap came from existing stocks. But the LBMA reported 28,213 tonnes of silver, roughly 907 million ounces, in London vaults alone in July 2026. A deficit of 40 Moz against that can run for many years, which is exactly what has happened.
How much silver should I hold?
There is no universal answer and this is not personal advice, but the distinction that matters is between a satellite allocation and a concentrated bet. At 5% of a portfolio, a 50% fall in silver costs you 2.5% — that is diversification. At 10% or more you are expressing a view and need the conviction and the time horizon to sit through a drawdown that has historically lasted years.
Data sources
- Metals Focus for The Silver Institute, World Silver Survey 2026, published 15 April 2026 — 2025 actuals and 2026 forecasts for supply, demand, industrial and photovoltaic demand and the market balance. Note that Metals Focus prepares this research for The Silver Institute, an industry association funded by silver miners, refiners and fabricators; its estimates are industry-sourced, not independently observed data.
- The Silver Institute, Global Silver Investment to Remain Strong in 2026, 10 February 2026 — earlier 2026 forecasts, superseded in part by the April survey. Where the two differ, this article uses the April figures.
- pv magazine, 15 April 2026, reporting Metals Focus photovoltaic silver demand of 186.6 Moz in 2025 and a forecast 151 Moz in 2026.
- LBMA London vault holdings, July 2026 — 28,213 tonnes of silver across approximately 940,000 bars.
- Spot prices from Kitco, 25 August 2026: silver US$68.12 bid, gold US$4,633.
- Reserve Bank of Australia daily exchange rates — AUD/USD 0.7169 on 24 August 2026; and the Monetary Policy Board statement of 11 August 2026 holding the cash rate at 4.35%.
- Australian Bureau of Statistics — CPI rose 3.8% in the year to June 2026.
- Australian Taxation Office: GSTR 2003/10 on what is precious metal for GST purposes; CGT discount; cost base of assets; list of CGT assets and exemptions; and guidance on the 2026 CGT reforms.
- Treasury Laws Amendment (Tax Reform No. 1) Act 2026, assented 26 June 2026, and the 2026–27 Budget explainer confirming the changes apply to all CGT assets.
- Global X Physical Silver prospectus, 14 April 2025, and the ETPMAG fund page (FUM and NAV as at 21 August 2026).
- Perth Mint storage fees and the Depository Program product information statement, January 2026.
- Dealer buy and buyback prices captured 25 August 2026 from Ainslie Bullion, ABC Bullion and Guardian Gold, used only as a source of live Australian transaction prices.
- Historical price series from MetalCharts, JM Bullion and SD Bullion; AUD conversions using US Federal Reserve H.10 and published historical exchange rates. Comparison asset returns from the 2026 Vanguard Index Chart, to 30 June 2026.
- Silver revenue shares from company Q2 2026 and FY2025 results releases and filings for Hecla, First Majestic, Wheaton Precious Metals, Fresnillo, Pan American Silver, Coeur Mining and DPM Metals.
Keep reading
General information only. This article is general information and does not take your objectives, financial situation or needs into account. It is not personal financial, tax or investment advice, and nothing in it is a recommendation to buy or sell any product mentioned. Prices, fees and rules stated were current on 25 August 2026 and change without notice. Forecasts and scenario probabilities are richer.au's own assumptions, clearly labelled as such, and are not predictions. Speak to a licensed financial adviser and a registered tax agent about your own circumstances.