Why this is not another best-ETFs list
Most "best ETFs" lists are a shopping catalogue: ten funds that all do roughly the same thing, ranked by last year's return. This is not that. This is a coverage map — the smallest set of ASX-listed ETFs that, put together, owns essentially the whole investable market rather than a fashionable corner of it.
The exercise matters because the gap between "diversified" and "actually diversified" is wider than most Australian portfolios admit. A single Australian share ETF sounds broad. It holds 321 companies. But 48.3% of it sits in ten names and 58.8% sits in two sectors, and it captures under 2% of the world's listed equity by value.
- Why this works — and why almost nobody beats it
- What "the entire market" actually means
- The seven ETFs, side by side
- Fund by fund: what each one is for
- Three ways to weight it
- What it has returned — and what it pays you
- What it costs — and why that is the twist
- Where the overlaps and gaps are
- The simpler builds: three, two, one fund
- Tax and admin, including the 2027 CGT change
- A rebalancing rule you will actually follow
- Frequently asked questions
Why this works — and why almost nobody beats it
Start with the arithmetic, because the arithmetic is not an opinion. In 1991 the Nobel laureate William Sharpe wrote a two-page paper called The Arithmetic of Active Management whose conclusion is close to unarguable: every share is owned by somebody, so the return of all investors combined is the market return. Index investors take that return minus a tiny fee. Everyone else — the fund managers, the stock pickers, the day traders — must, in aggregate, also earn the market return, but they pay far more to do it. Before costs, active and passive investors earn the same. After costs, active investors as a group must earn less. Not usually. Necessarily.
“Don't look for the needle in the haystack. Just buy the haystack.” — John C. Bogle, founder of Vanguard
The scoreboard, not the theory
S&P Dow Jones Indices publishes a scorecard called SPIVA that compares every active fund in a category against the index it is trying to beat. The Australian edition to 30 June 2025 is not close.
Read the global equity line again. Roughly nineteen out of twenty professional international share managers, running teams of analysts with Bloomberg terminals and company access, lost to an index you can buy for 18 basis points. And that is the survivors — funds that closed mid-period drop out of the comparison, which flatters the average.
Why the hedge funds do not save you either
In 2007 Warren Buffett bet $1 million that a plain S&P 500 index fund would beat a basket of hedge funds chosen by a specialist fund-of-funds manager over ten years. Protégé Partners took the other side and picked five funds-of-funds. Over the decade to 31 December 2017 the index fund compounded at 7.1% a year. The hedge funds averaged 2.1%. Buffett's winnings went to Girls Inc. of Omaha.
The reason is not that hedge fund managers are stupid. It is structural, and it is worth understanding because the same three forces apply to any expensive strategy:
- The fee stack is enormous. A classic “2 and 20” fee — 2% of assets plus 20% of gains — means a fund earning 10% gross hands you roughly 6.4%. On an 8%-a-year market, matching a 0.18% index fund takes a gross return of about 11.8% — nearly four percentage points a year better, forever, before it adds a single cent.
- Everyone on the other side is also a professional. When a manager buys, another manager sells. Sharpe's arithmetic applies inside the professional pool just as it does across the whole market: their collective edge over each other is zero before costs.
- Skill does not persist. S&P's persistence scorecards repeatedly find that top-quartile funds rarely stay there. Last year's star is next year's cautionary tale, and you cannot know which in advance — you are picking after the fact, from a list assembled by marketers.
What this means if you are an ordinary person with savings
Here is the genuinely liberating part. You do not need an edge. The market return has been sitting there the whole time, available to anyone with a brokerage account and the patience to leave it alone, and it is the same return the professionals are collectively failing to beat.
What actually determines how you finish is not stock selection. It is four things, in roughly this order:
- How much you put in, and how consistently. Over the first decade this dwarfs returns. Nobody's portfolio was rescued by fund selection at a 4% savings rate.
- Your split between growth and defensive assets. This drives most of the difference in how a portfolio behaves — both the return and the size of the falls you have to sit through.
- Cost. Fees are the only variable in the whole exercise that is known in advance and compounds against you with perfect reliability.
- Whether you sell at the bottom. The best strategy you will not stick to is worse than the mediocre one you will.
Notice that three of the four are entirely within your control, and none of them require you to be right about anything. That is the case for the seven funds below: not that they are clever, but that they let you stop needing to be.
In his 2013 letter to Berkshire Hathaway shareholders, Warren Buffett described the instructions in his own will for the cash left to his wife: put 10% in short-term government bonds and 90% in a very low-cost index fund. The greatest active investor of the century directed his own family's money into the passive approach — on the grounds that it is what a non-professional should hold.
What "the entire market" actually means
"The market" is a slippery phrase. When an Australian says it they usually mean the ASX 200. When an index provider says it they mean something far larger: MSCI's ACWI IMI benchmark held 8,176 constituents across 23 developed and 24 emerging markets at 31 July 2026, and describes itself as covering approximately 99% of the global equity investment opportunity set.
That opportunity set breaks into five natural slices, and each slice needs its own fund because no single ASX-listed ETF spans all of them. Weight them by free-float market capitalisation and the picture looks nothing like a typical Australian portfolio.
Nobody is suggesting an Australian should hold 2% Australian shares. Franking credits, currency, and the fact that you spend your money in dollars all argue for a home tilt. But the chart is the reason you need more than one fund: four of the five slices are things the ASX simply cannot give you.
The seven ETFs, side by side
All seven are ASX-listed, physically backed, index-tracking funds. Six are Vanguard products, which is not brand loyalty — it is that Vanguard is the only issuer with a single-provider fund for every slice, which keeps the index methodology consistent and the overlaps predictable. Cheaper substitutes for two of them are covered further down.
| Ticker | Fund | What it covers | Holdings | Mgmt cost |
|---|---|---|---|---|
| VAS | Vanguard Australian Shares Index ETF | S&P/ASX 300 — Australian large and mid caps | 321 | 0.07% |
| VSO | Vanguard MSCI Australian Small Companies Index ETF | Australian small caps below the ASX 300 core | ~180 | 0.30% |
| VGS | Vanguard MSCI Index International Shares ETF | MSCI World ex-Australia — developed large/mid | 1,247 | 0.18% |
| VISM | Vanguard MSCI International Small Companies Index ETF | MSCI World ex-Australia Small Cap | 3,703 | 0.32% |
| VGE | Vanguard FTSE Emerging Markets Shares ETF | Emerging markets, all cap, incl. China A shares | 6,332 | 0.48% |
| VAF | Vanguard Australian Fixed Interest Index ETF | Australian government and corporate bonds | — | 0.10% |
| VBND | Vanguard Global Aggregate Bond Index (Hedged) ETF | Global investment-grade bonds, AUD hedged | — | 0.20% |
Holdings and management costs from Vanguard fund fact sheets and the Vanguard ETF performance summary, 30 June – 31 July 2026. VSO holdings count approximate.
Five of these funds own shares. Two own debt. Between them there is no listed asset class of consequence that goes unrepresented — which is exactly what makes the list boring, and exactly why it works.
Fund by fund: what each one is for
1. VAS — the Australian core (0.07% p.a.)
The S&P/ASX 300 in one line, and the cheapest broad Australian exposure of the seven at seven basis points. At 31 July 2026 it held 321 companies and roughly $26.2 billion in the ETF class alone.
It is also the most concentrated fund on this page. The top ten holdings are 48.3% of it, and the sector split is not what a global investor would design from scratch.
2. VSO — the Australian tail (0.30% p.a.)
VAS stops at the 300th largest company. VSO picks up what sits below and beside it, tracking MSCI's Australian small-cap index. Two honest caveats. First, the overlap with VAS is real: the bottom half of the ASX 300 and the top of the small-cap index describe some of the same companies, so this is a tilt as much as a coverage fix. Second, the record has been ordinary — the benchmark returned 11.73% over the year to 30 June 2026 but only 6.09% a year over five years, against VAS at 7.56%.
Own it because you want the whole Australian market, not because you expect small caps to win.
3. VGS — the engine room (0.18% p.a.)
The single most important fund on this list. VGS tracks MSCI World ex-Australia — 1,247 developed-market large and mid caps in AUD, unhedged, with $17.2 billion in the ETF at 31 July 2026. It is where the technology, pharmaceutical and consumer franchises Australia does not have actually live: NVIDIA, Apple, Alphabet, Microsoft, Amazon and Broadcom sat at the top of it.
The trade-off is a country skew you should see clearly: the United States is 73.2% of it, Japan 5.8%, the United Kingdom 3.7%, Canada 3.5% and France 2.5%. VGS is not a hedge against American concentration. It is a way of buying it deliberately.
4. VISM — developed small caps (0.32% p.a.)
3,703 holdings, roughly $926 million in the ETF, tracking MSCI World ex-Australia Small Cap. This is the slice most Australian portfolios miss entirely, and it is not small: about 12% of global listed equity by value sits below the large/mid cut-off. Its benchmark also had the best year of the seven to 30 June 2026, at 23.60%, though its five-year record of 9.36% a year sits behind VGS.
5. VGE — emerging markets (0.48% p.a.)
The most expensive fund here and the one that does the most diversifying work. VGE tracks the FTSE Emerging Markets All Cap China A Inclusion index — 6,332 holdings at 30 June 2026, spanning China, India, Taiwan, Brazil and roughly 20 other markets, with mainland-listed China A shares included rather than excluded.
It is genuinely diversified at the stock level: Taiwan Semiconductor is the largest position at under 5%, and the top ten come to roughly 19% — less than half the concentration of VAS. What it carries instead is political and governance risk, which is the real reason its five-year benchmark return of 5.93% a year lags everything except bonds.
6. VAF — Australian bonds (0.10% p.a.)
Commonwealth and state government paper plus investment-grade corporate debt, in AUD, at ten basis points. Nobody buys this for the return — the benchmark returned 2.62% over the year to 30 June 2026 and 3.91% a year over five. You buy it because it is the asset that behaves differently when equities fall, and because it is the only sleeve you can spend from in a bad year without selling shares at the bottom.
7. VBND — global bonds, hedged (0.20% p.a.)
The Australian bond market is a rounding error globally and heavily weighted to a handful of issuers. VBND buys the global investment-grade universe — sovereign and corporate, dozens of countries — and hedges the currency back to Australian dollars, which is the right call for a defensive holding. Unhedged foreign bonds are a currency bet wearing a bond costume.
Currency movement is roughly as volatile as the entire return of a bond portfolio, so leaving global bonds unhedged destroys the reason you hold them. Equities are volatile enough that currency is a smaller share of the noise, and an unhedged position quietly helps Australians — the dollar tends to fall when global markets fall, cushioning the loss. Hence VBND hedged, VGS and VISM unhedged.
Three ways to weight it
Owning the right seven funds is the easy part. The weights are where the actual decisions are, and there is no single correct answer — only three defensible ones.
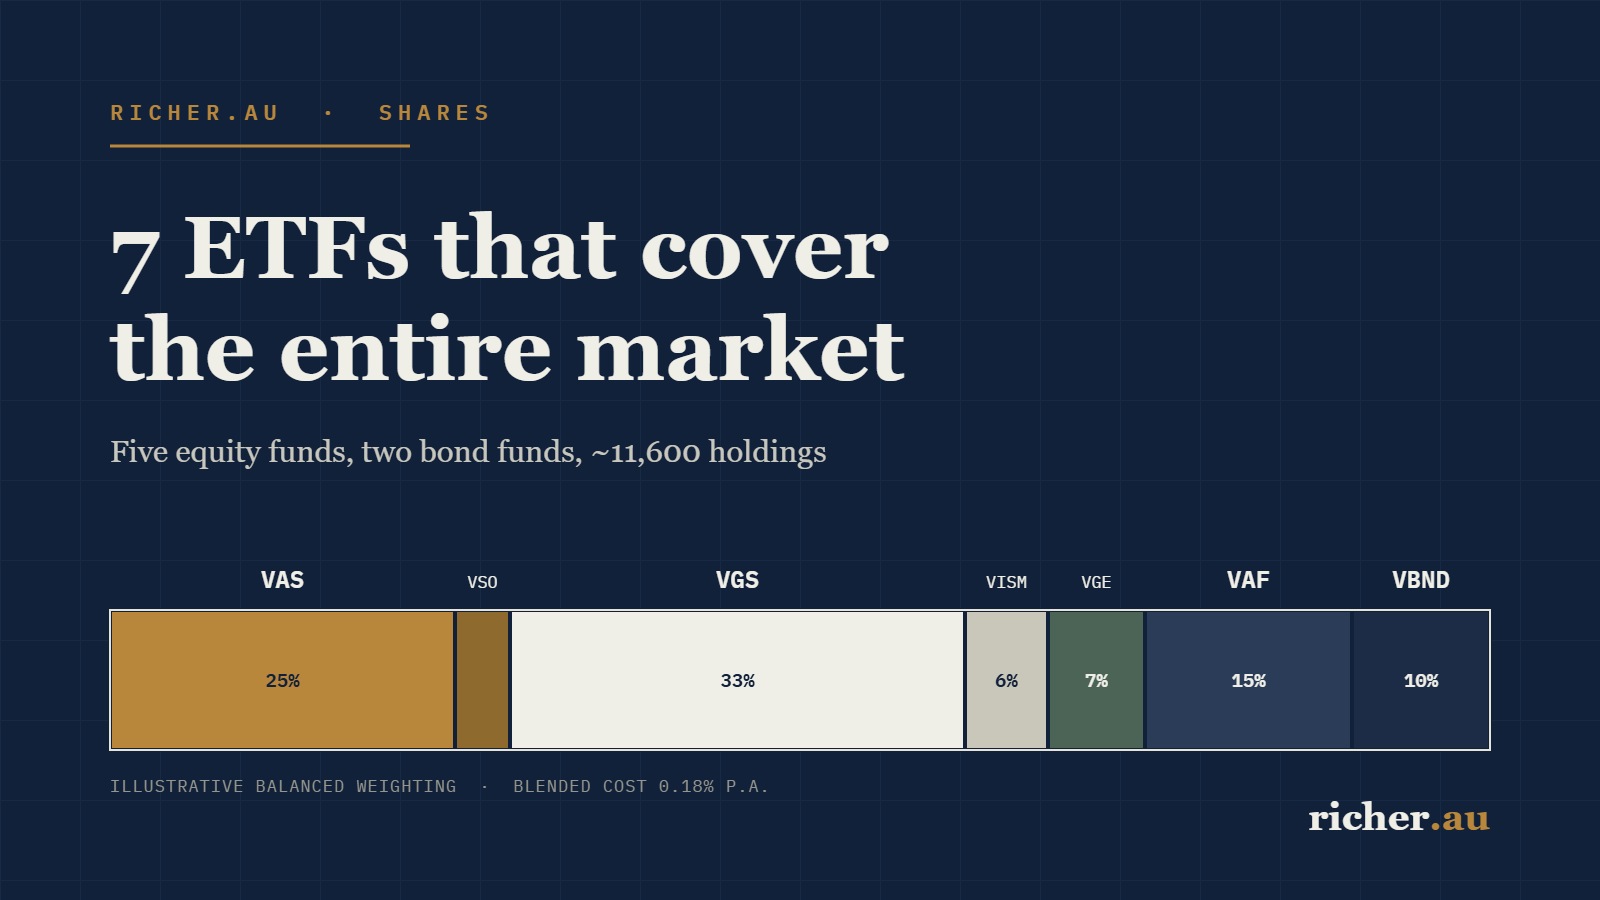
| Fund | A. Market weight | B. Home-tilted growth | C. Balanced 75/25 |
|---|---|---|---|
| VAS | 1.7% | 30% | 25% |
| VSO | 0.3% | 5% | 4% |
| VGS | 74.5% | 45% | 33% |
| VISM | 12.0% | 8% | 6% |
| VGE | 11.5% | 12% | 7% |
| VAF | — | — | 15% |
| VBND | — | — | 10% |
| Blended cost | 0.23% | 0.20% | 0.18% |
Column A is the theoretically pure answer: own the world exactly as it is priced. It is also the one almost nobody implements, because holding 1.7% Australian shares means forfeiting franking credits and running a portfolio whose value swings with the AUD.
Column B is the standard Australian growth build — 35% domestic, 65% global, no bonds. The 35% home allocation is roughly twenty times Australia's market weight. That is a deliberate bet on franking, familiarity and currency, and it should be made with your eyes open rather than by default.
Column C adds a 25% defensive sleeve split between Australian and hedged global bonds. It is the closest of the three to what a diversified super fund's balanced option actually holds.
These are illustrations of how the seven funds fit together, not advice. The right split between growth and defensive assets depends on your timeframe, income, other assets and tolerance for a 30% drawdown — none of which a web page knows.
What it has returned — and what it pays you
Cost is the easy half of the story. What the funds have actually delivered, and how much of that arrives as cash you can spend, matters more — particularly if you are drawing an income rather than accumulating.
| Ticker | 1 year | 5 years p.a. | 10 years p.a. | Distribution yield |
|---|---|---|---|---|
| VAS | 6.12% | 7.56% | 9.37% | 2.84% |
| VSO | 11.73% | 6.09% | 9.37% | 4.98% |
| VGS | 14.96% | 13.43% | 14.12% | 1.60% |
| VISM | 23.60% | 9.36% | — | 5.69% |
| VGE | 16.20% | 5.93% | 8.39% | 2.00% |
| VAF | 2.62% | 3.91% | 2.57% | 3.22% |
| VBND | 2.76% | — | — | 5.95% |
Benchmark total returns to 30 June 2026 from the Vanguard ETF performance summary. Distribution yields are trailing twelve-month figures at August 2026 and exclude franking credits. VISM and VBND have no ten-year record. Past performance is not an indicator of future performance.
Read the yield column carefully
A high distribution yield on an ETF is not the same thing as a high dividend. Australian ETFs are trusts, and they must distribute realised capital gains as well as income — so a fund that has been rebalancing hard, like VISM, can show a headline yield above 5% that is mostly returned capital rather than a durable income stream. Three qualifications worth carrying:
- VAS understates its real income. The 2.84% excludes franking credits. Grossed up, an Australian-share investor on a low or nil tax rate is receiving materially more than the headline.
- VGS pays very little. 1.60% is what a US-heavy index looks like when the largest companies buy back stock instead of paying dividends. Its return arrives as growth, which is a tax deferral, not a tax saving.
- The bond sleeves do the income work. VBND's 5.95% and VAF's 3.22% are the two most reliable cash-producing lines on the page.
Weighting the whole thing, not the parts
Individual fund returns are close to useless on their own, because nobody holds one fund. What matters is the weighted average across the portfolio you actually own — and the same weighting arithmetic that produces the return also produces the risk reduction, because the sleeves do not fall at the same time or by the same amount.
| Weighted portfolio outcome | A. Market weight | B. Home-tilted growth | C. Balanced 75/25 |
|---|---|---|---|
| 1-year return | 15.98% | 12.99% | 10.15% |
| 5-year return p.a. | 11.96% | 10.08% | 8.52% |
| Less blended management cost | −0.23% | −0.20% | −0.18% |
| 5-year return, net of fees | 11.73% | 9.88% | 8.34% |
| Distribution yield | 2.17% | 2.52% | 3.00% |
| Income on $100,000 | $2,170 | $2,520 | $3,000 |
| Growth assets | 100% | 100% | 75% |
Weighted averages of the fund figures above, using the target weights in the previous section. VBND has no five-year record; VAF's five-year return is used as the proxy for the global bond sleeve in column C. Illustrative only — these are historical index outcomes, not forecasts.
Why weighting is the risk control
A weighted average return is simple addition. Weighted average risk is not — and that asymmetry is the entire free lunch in investing. Because the seven sleeves do not move together, the portfolio's swings are smaller than the weighted average of the individual swings. Australian shares and global shares have both had years down more than 20%; they were not the same years, and the currency moved the other way each time.
Three practical consequences:
- Set weights, then let the market move them. The five-year column above is dominated by one sleeve, VGS, because the US ran hard. A market-weighted investor captured that; they also had no way of knowing in advance that they would. Set the weight for the decade, not for the run just finished.
- Buy the laggard with new money. Directing each contribution to whichever sleeve is furthest below its target is dollar-cost averaging and rebalancing in a single act, with no sale and therefore no tax event.
- Expect the weighted average, not the best line. Column A returned 11.96% a year over five years and column C 8.52%. The gap is not skill. It is 25% in bonds, bought deliberately, in exchange for a much smaller fall when equities next drop a third.
What it costs — and why that is the twist
Here is the part that should change how you think about the exercise. Assembling all seven funds yourself, in the balanced weighting, costs about 0.18% a year. Betashares' single all-growth fund, DHHF, charges 0.19%. Vanguard's VDHG charges 0.27%.
So the seven-fund build does not win on fees. On a $100,000 portfolio the gap between the balanced build and DHHF is about $10 a year — less than one brokerage trade. Anyone selling the DIY approach on cost savings is selling you something.
You do not build this portfolio to save money. You build it to control the three things a single diversified fund decides for you: the home-country weight, the growth/defensive split, and when to rebalance.
That control has a price, and it is paid in brokerage and attention. Seven funds means up to seven trades per contribution. At $5 a trade that is $35 — on a $2,000 monthly contribution, 1.75%, which dwarfs every fee on this page. The practical answer is to buy one or two funds per contribution, directing money to whichever sleeve is furthest below target, and let the rebalancing happen through new money rather than through selling.
Where the overlaps and gaps are
The overlaps you should know about
- VAS and VSO share companies. The ASX 300 already reaches well down the market-cap ladder, and MSCI's Australian small-cap index starts higher than most people assume. Treat VSO as a small-cap tilt with some genuine extra coverage attached, not as a clean extension.
- VGS and VISM do not overlap — large/mid and small are cleanly separated in MSCI's methodology, so the two sit side by side without double counting.
- VGE overlaps with nothing else here. VGS is explicitly developed-market only.
- Listed property and infrastructure are already inside your equity funds. Real estate is 6.0% of VAS, and REITs sit inside VGS and VISM too. Adding a dedicated global property ETF does not extend your coverage — it doubles down on a sector you already own. That is a legitimate choice, but call it a tilt, not diversification.
What these seven still do not cover
Honesty about the gaps matters more than the coverage claim:
- Unlisted assets — private equity, private credit, unlisted infrastructure and direct property are outside every index here. For most Australians the largest of these is the family home, which is already a very large undiversified position.
- Commodities and gold — you own the miners, not the metal. Whether that gap matters is a separate argument.
- Frontier markets — the last 1% of the investable universe, and not worth an eighth fund.
- High-yield and emerging-market debt — VBND is investment grade only by design.
- Digital assets — not in any of these indices.
The simpler builds: three funds, two funds, one fund
Seven is the maximum sensible number, not the recommended one. Coverage rises steeply from one fund to three and then flattens out.
| Build | Funds | What you give up | Blended cost |
|---|---|---|---|
| One fund | DHHF | All control over weights; no bond sleeve | 0.19% |
| One fund | VDHG | All control over weights; fixed 10% bonds | 0.27% |
| Two funds | A200 + BGBL | Small caps, emerging markets, bonds | ~0.07% |
| Three funds | VAS + VGS + VGE | Small caps worldwide, bonds | ~0.19% |
| Five funds | + VSO + VISM | Bonds only — full equity coverage | ~0.20% |
| Seven funds | + VAF + VBND | Nothing listed of consequence | ~0.18% |
Two swaps are worth knowing about if cost is your priority. Betashares A200 tracks the largest 200 Australian companies for 0.04% — three basis points cheaper than VAS, at the price of 100 smaller holdings. Betashares BGBL covers developed global shares for 0.08%, less than half VGS. Using both in the growth build pulls the blended cost from 0.20% to about 0.15%. The counter-argument is that Vanguard's funds are older, larger and more liquid, and that mixing index providers reintroduces gaps and overlaps at the edges.
Tax and admin for Australian investors
The mechanics matter more than most fund-selection debates — and one of them is about to change for everybody.
The 2026–27 Federal Budget replaces the 50% capital gains tax discount for individuals, trusts and partnerships with cost-base indexation plus a 30% minimum tax rate on net capital gains, from 1 July 2027. It applies to CGT assets generally — listed shares and ETF units included, not only property. Complying superannuation funds keep their existing one-third discount. Gains that accrued before 1 July 2027 remain under the 50% discount, so assets held across the changeover are apportioned between the two regimes.
What that actually does to the seven funds:
- The twelve-month rule stops being the whole story. Until 30 June 2027, holding units for more than a year still halves the taxable gain. After that, the length of the hold matters through inflation indexation instead — your cost base is lifted by CPI, so only the real gain is taxed. In a low-inflation decade that is a good deal less generous than a 50% discount; in a high-inflation one, less so.
- The 30% floor bites hardest on low- and middle-rate investors. Someone on a 16% or 30% marginal rate currently pays 8% or 15% on a discounted long-term gain. From 1 July 2027 the minimum on a real gain is 30%, regardless of marginal rate. Top-rate investors are relatively better off under the new rules than they were; modest earners are relatively worse off. Recipients of the Age Pension and other income support are exempt from the 30% floor.
- Superannuation becomes comparatively more attractive. A complying fund retains the one-third discount, so the same seven ETFs held inside super or an SMSF face a lighter capital gains regime than the same units held in your own name.
- Records now matter twice. Because gains straddle 1 July 2027, you will need a defensible market value for each parcel at that date. Keep your holding statements and distribution statements; do not rely on a broker's portfolio screen.
- The rebalancing argument gets stronger, not weaker. Every sale is a taxable event under either regime. Directing new contributions to whichever sleeve is furthest below target still avoids the question entirely.
The rest of the plumbing is unchanged:
- Franking credits. VAS and VSO distribute franking credits; the global funds do not. This is the single strongest financial argument for a home-country tilt, and it is worth more to low-rate and pension-phase investors than to those on the top marginal rate.
- All seven are AMIT trusts. Distributions arrive as a mix of income, foreign income, capital gains and tax-deferred amounts, and your annual tax statement will adjust the cost base of your units. Keep every AMMA statement — without them your capital gains tax calculation on sale will be wrong.
- Distribution reinvestment plans are available on the Vanguard funds and are the low-friction way to compound, but each reinvestment is still a taxable distribution and a new parcel with its own cost base, holding period and — from 2027 — its own indexation history.
- Foreign income and the withholding tax drag. VGS, VISM and VGE all suffer withholding tax inside the fund on foreign dividends, some of which you can claim as a foreign income tax offset. It is a real, small, unavoidable cost of global diversification.
None of this is tax advice, and the transitional rules are genuinely fiddly. If you hold meaningful parcels across 1 July 2027, it is worth an hour with a registered tax agent before that date rather than after it. If you are weighing all of this against property, the same reforms cut the other way there too — see our analysis of what actually changed with negative gearing in 2026 and whether residential investment property is still worth it.
A rebalancing rule you will actually follow
The best rebalancing policy is the one that survives contact with a bad year. Three rules that work:
- Contribute to the laggard. Each time you invest, buy whichever fund sits furthest below its target weight. Most portfolios never need a sell trade.
- Use a 5% absolute band. Only act when a sleeve drifts more than five percentage points from target — not every quarter, and not every time a headline appears.
- Write the targets down before you need them. A rebalancing rule invented during a 30% drawdown is not a rule, it is a reaction.
For the wider context on where shares sit against the other pillars, start at the shares hub, or read our piece on fusion energy and the AI power crunch for the opposite end of the risk spectrum — a thematic bet that these seven funds deliberately do not make.
Frequently asked questions
Do seven ETFs really cover the entire market?
They cover essentially all of the listed market. The five equity funds together track indices spanning developed and emerging markets at every size band — the benchmark family they sit within describes itself as covering about 99% of the global equity opportunity set — and the two bond funds cover Australian and global investment-grade debt. What they do not cover is anything unlisted: private equity, private credit, direct property and unlisted infrastructure.
Is seven ETFs too many?
For most people, yes. Coverage improves sharply from one fund to three and then only marginally. If you would not enjoy tracking seven target weights across a decade, a single diversified fund such as DHHF or VDHG buys you almost the same exposure and costs about the same. Seven funds is for investors who want to set the home-country weight and the growth/defensive split themselves.
How much should an Australian hold in Australian shares?
Australia is under 2% of global listed equity, and typical Australian portfolios hold 30–40%. Neither number is right. The arguments for a home tilt are franking credits, spending your money in Australian dollars, and no currency risk on the domestic sleeve; the argument against is that it concentrates you in banks and miners, which are 58.8% of the index. Anywhere between 20% and 40% is defensible; the important thing is choosing it rather than inheriting it.
Should I hedge the currency on international shares?
For long-horizon equity exposure, unhedged is the more common choice, partly because the Australian dollar tends to fall during global market stress, cushioning losses in AUD terms. Hedged versions exist (VGAD is the hedged twin of VGS) and cost a little more. Bonds are the opposite case: hedge them, because currency swings are large relative to bond returns.
Can I hold these seven ETFs in an SMSF?
Yes — all seven are ordinary ASX-listed securities and are commonly held in SMSFs, where franking credits from the Australian sleeve are particularly valuable in pension phase. The usual SMSF rules apply: the holdings must be consistent with your documented investment strategy, and the fund must be able to meet its liquidity and pension payment requirements.
What about a global property or infrastructure ETF as an eighth fund?
You already own listed property and infrastructure inside the five equity funds — real estate alone is 6.0% of VAS. A dedicated REIT or infrastructure ETF increases your weight to those sectors rather than extending your coverage. That can be a reasonable decision for income or inflation reasons, but it is a tilt, not a gap being filled.
How do the 2027 capital gains tax changes affect an ETF portfolio?
From 1 July 2027 the 50% CGT discount is replaced, for individuals, trusts and partnerships, by cost-base indexation plus a 30% minimum tax rate on net capital gains — and it applies to ETF units, not just property. Gains accrued before that date keep the old treatment, so holdings that straddle the changeover are apportioned. Complying super funds keep the one-third discount, which makes holding the same seven funds inside super or an SMSF comparatively more attractive. The practical response is unchanged: rebalance with new contributions rather than by selling, and keep every statement.
About these figures. Fund names, tickers, management costs and index details were taken from issuer fact sheets and product pages published between 30 June and 31 July 2026 and can change without notice.