3100 · Precious metals
Gold fell 27%. Is it cheap now?
Gold has fallen 27% from January's record as rates rise. We test whether it is now underpriced — on value, 20-year returns, rates, stagflation, central banks and supply — then cover the ASX miners, ETFs and forecasts.
The best year in nearly half a century, then the worst October since 2008
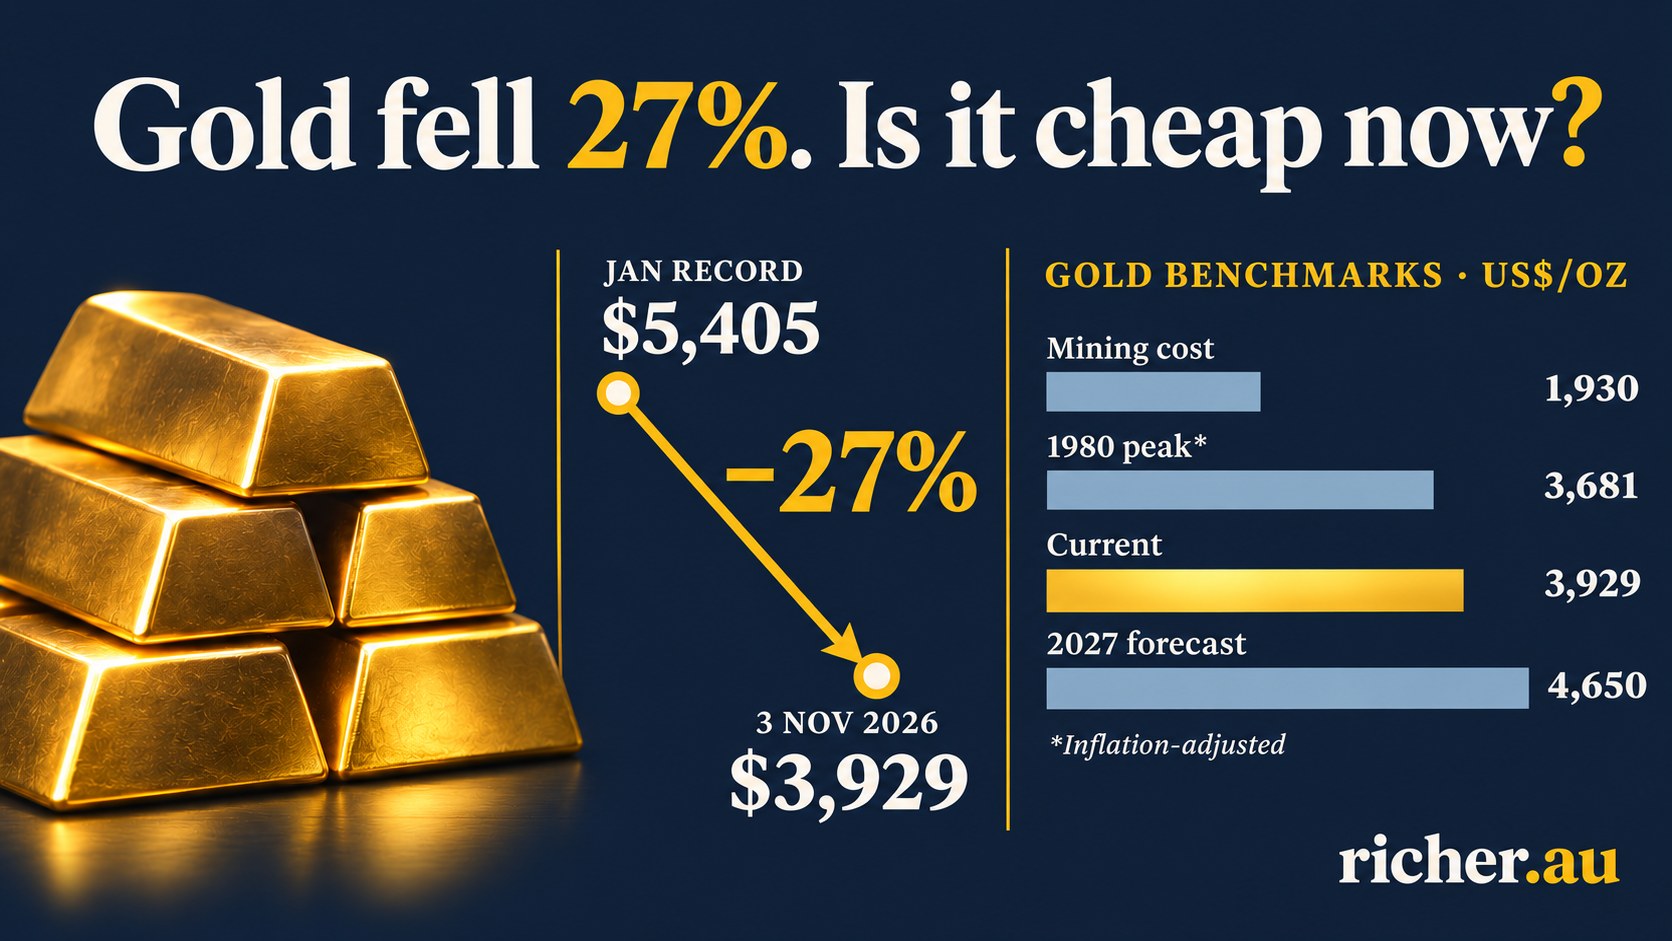
In 2025 gold rose 67% in US dollars and 55% in Australian dollars, setting 53 record highs along the way. It kept going into 2026 and peaked at US$5,405 an ounce (A$7,701) on the London afternoon fix of 29 January. Then it turned. A reported one-day fall of about 12% at the end of January, the biggest monthly fall since 2008 in June, and another heavy month in October have taken it back to US$3,929 at the New York close on 3 November — about A$5,633 at the Reserve Bank's exchange rate that day.
That is a 27% fall from the top, in both currencies. So the obvious question is whether gold is now underpriced: whether the sell-off has gone too far, or whether January was the bubble and today is simply the price coming back to earth.
There is no clean answer, and anyone who gives you one is selling something. What there is, is evidence. This article works through it the way an investor should: what gold is worth on the measures people actually use, how it has done against shares, property, bonds and cash over twenty years, how it behaves when interest rates are high and when inflation and unemployment rise together, whether the central banks behind the boom are still buying, whether mines can keep up, how much of a portfolio it deserves, and which ASX shares and funds give you exposure. Then the forecasts, and then a conclusion.
- Where gold stands in November 2026
- Is gold underpriced? Six tests
- Gold against other investments over 20 years
- Gold when interest rates are high
- Gold in stagflation
- Are central banks still buying?
- Is supply keeping up with demand?
- Should a portfolio include gold?
- The ASX gold miners
- ASX gold ETFs and bullion
- Tax: GST, CGT and the 2027 change
- What analysts are predicting
- The case against gold
- Conclusion: underpriced, or just less overpriced?
- Frequently asked questions
Data updated 4 November 2026. Prices move daily; every figure below carries its date.
Where gold stands in November 2026
Start with the price path, because the timing explains most of the argument. Gold ended 2025 at US$4,368 (A$6,546) on the London afternoon fix. It added another quarter in four weeks of January, peaking at US$5,405 on 29 January — the intraday spot high that day was near US$5,595. The fall began the same week, after the nomination of Kevin Warsh as the next Fed chair and a sharp rebound in the US dollar.
The second leg came with rates. US inflation re-accelerated through 2026 — September CPI was 3.7% — and on 16 September the Federal Reserve raised its target range to 3.75–4.00%, its first hike since 2023. Markets now price a 77% chance of another in December. The US 10-year Treasury yield reached 5.3% in September, and the 10-year inflation-protected (TIPS) yield hit 2.95% on 5 October, the highest since November 2008. A war involving Iran pushed Brent crude to about US$117 a barrel at the end of October, adding to inflation fears rather than to safe-haven buying. Gold broke below US$4,000 on 23 October and touched a one-year low of US$3,891.67 on 30 October, the day an AI and technology sell-off forced margin-call selling across markets. October was gold's worst since 2008.
| Date | Gold (US$/oz) | Gold (A$/oz) | What happened |
|---|---|---|---|
| 31 Dec 2025 | 4,368 | 6,546 | 2025 up 67% (US$), 55% (A$) |
| 29 Jan 2026 | 5,405 | 7,701 | Record (LBMA PM) |
| 30 Jun 2026 | — | 5,811 | June down ~12%, worst month since 2008 |
| 30 Sep 2026 | 4,176 | 6,008 | Fed hikes 16 Sep |
| 3 Nov 2026 | 3,929 | 5,633 | 27% below record; RBA hikes to 4.85% |
LBMA PM fixes via the World Gold Council, except 30 June (Perth Mint end-of-financial-year price) and 3 November (New York spot close via Guardian Gold, converted at the RBA rate of 0.6976).
Two things are worth noticing. First, the Australian-dollar investor was hurt less in 2025 and more in 2026: the dollar has risen to around 70 US cents, so gold is down about 14% this year in Australian dollars against about 10% in US dollars. Second, gold is still up roughly seven-fold since late 2006 in Australian dollars. A 27% fall is a big correction. It is not a collapse of the long-run story — which is exactly why the "is it cheap?" question is harder than it looks.
Is gold underpriced? Six tests
Gold produces no earnings, rent or coupon, so there is no discounted-cash-flow value to compare the price with. "Underpriced" has to mean underpriced relative to something. Here are the six comparisons analysts actually use, with today's readings.
1. Against its own history, in real terms
The famous January 1980 peak was US$850. Adjusted by US consumer prices to September 2026, that is about US$3,681. At US$3,929, gold is roughly 7% above its 1980 high in real terms. In 1980 that price proved to be a top that took 28 years to regain in nominal terms. On this test gold is not cheap — it is at the upper end of anything it achieved before 2024.
2. Against shares
The S&P 500 divided by the gold price was 1.93 on 3 November 2026. It was 0.18 at the 1980 gold peak, 5.47 at the 2000 sharemarket peak and 0.67 at the 2011 gold peak. Today sits in the middle of that range: neither the extreme of gold euphoria nor the extreme of neglect. On this test gold is fairly priced against shares, which are themselves expensive.
3. Against money printing
Gold bulls argue the price should track the supply of dollars. US M2 money supply was US$23.4 trillion in September 2026. Per trillion dollars of M2, gold is about US$168 today, against about US$191 at the 2011 peak and about US$573 at the 1980 peak (US$58 at the 2000 low). Incrementum's In Gold We Trust 2026 report makes a related point: gold covers about 22% of the US monetary base today, against 131% in 1980. On this test gold looks cheaper than at its previous peaks — though no rule says it must return to them.
4. Against everything else people own
The World Gold Council estimates about 224,200 tonnes of gold have ever been mined (end of September 2026). At US$3,929 that is worth roughly US$28 trillion — about 18% of the value of the world's listed shares, about 18% of the world's bonds and about 8% of the US$365 trillion of global debt the Institute of International Finance counted mid-year. Almost half of that gold is jewellery and 18% sits in central banks, so the investable part is much smaller: Incrementum puts privately held investment gold at about 2.7% of global financial assets. On this test gold is under-owned, if you believe allocations will rise.
5. Against the cost of mining it
The industry's average all-in sustaining cost (AISC) hit a record US$1,930 an ounce in the June quarter of 2026. Gold sells at about twice that. For most of the 2010s it traded at 1.2 to 1.5 times AISC. Mining costs set a rough floor in a bear market, because high-cost mines close and supply shrinks; today's price is nowhere near it. On this test gold is expensive — miners are making record margins, which is what happens near the top of a cycle and also what funds the next wave of supply.
6. Against interest rates
From 2005 to 2021 gold moved almost lockstep, in reverse, with US real interest rates: RBC Wealth Management found the 10-year TIPS yield explained about 84% of gold's movements. By that old rule, a real yield of 2.60% (30 October 2026) would put gold far below US$2,000. The relationship broke in 2022 — the same measure explained only 3% of gold's movements in 2022–23 — because central banks bought regardless of yields. On this test gold is either very expensive or the test no longer works. It is the most important argument in the whole debate, and we return to it below.
| Test | Reading (latest) | Verdict |
|---|---|---|
| Real price vs 1980 peak | +7% | Not cheap |
| S&P 500 ÷ gold | 1.93 | Middle of range |
| Gold per US$1tn of M2 | US$168 | Below 2011 and 1980 peaks |
| Gold stock vs global debt | ~8% | Under-owned |
| Price ÷ mining cost (AISC) | 2.0× | Expensive |
| 10-yr real yield (TIPS) | 2.60% | Expensive on the old rule |
Score it honestly and you get two tests saying expensive, one saying fair, and three saying cheap only if the future looks like the 1970s or the last three years. That is the real shape of the argument. Gold is not underpriced by history. It may be underpriced by the new buyers.
Gold against other investments over 20 years
Over the two decades to 30 June 2026, gold returned 10.2% a year in Australian dollars, according to State Street's July 2026 study for Australian investors (9.8% in US dollars). Vanguard's 2026 Index Chart gives the comparison for the same twenty years, all in Australian dollars with income reinvested.
| Asset, 20 years to 30 Jun 2026 (A$) | Return p.a. | A$10,000 became |
|---|---|---|
| US shares (S&P 500) | 11.8% | $93,100 |
| Gold | 10.2% | $69,800 |
| International shares (MSCI World ex-Australia) | 9.1% | $57,100 |
| Australian shares (All Ordinaries) | 7.2% | $40,200 |
| Listed property (ASX 200 A-REITs) | 4.4% | $23,700 |
| Australian bonds (AusBond Composite) | 4.2% | $22,800 |
| Cash (bank bills) | 3.3% | $19,100 |
| Inflation (CPI) | 2.7% | $17,000 |
Vanguard Index Chart 2026 (total returns, A$); gold from State Street Global Advisors, July 2026. Dollar values compounded by richer.au; no fees or tax.
Residential property is harder to put on the same footing. Livewire's 2025 long-term report, using Cotality's hedonic total-return index (capital growth plus rent, before costs), found residential investment property returned 9.2% a year over the 20 financial years to June 2025 — ahead of Australian shares (7.6%) and close to gold in that study (10.7%, US dollars). Since then national values have fallen: Cotality's index was down 2.8% over the year to October 2026, with a total return of just 0.5% once rent is counted. Leverage, stamp duty, land tax and maintenance change property's numbers for any individual, in both directions.
So gold has, remarkably, kept pace with a diversified share portfolio for twenty years while paying nothing. Three caveats stop that from being the whole story.
- The start date flatters it. June 2006 was early in gold's bull market and just before the global financial crisis. Measured from the 1980 peak instead, gold took 28 years to regain its nominal high and only passed it in real terms in 2025, some 45 years later.
- The end date flatters it too. The 30 June 2026 price (A$5,811) caught most of the 2025 surge. A year earlier the 20-year figure was lower, and a 27% fall from the peak shows how fast it can change.
- Gold is more volatile than shares. Morningstar measured gold's volatility at 19.7% against 15.3% for US shares over 1972 to 2025. The Australian-dollar series is smoother — State Street puts it at 16.5% over twenty years — because the dollar tends to fall when gold rises.
The bear markets you have to be able to sit through
| Bear market | Peak to trough | Time to regain the high |
|---|---|---|
| Jan 1980 – Feb 2001 (US$) | −70% | About 28 years (nominal) |
| Jan 1980 – Jun 1982 (US$) | −65% | The first leg of the above |
| Sep 2011 – Dec 2015 (US$) | −45% | About 9 years (Aug 2020) |
| 2011 – 2013 (A$) | about −25% | About 5 years (Jun 2016) |
| Jan – Oct 2026 (US$ / A$) | −27% | Not yet regained |
Metalcharts, Perth Mint, Mining Weekly, IndexMundi monthly averages; 2026 from the LBMA PM record and the 3 November close.
The Australian-dollar line is the one that matters for most readers, and its bear markets have been shallower because a falling gold price usually comes with a falling Australian dollar. But "shallower" still meant five years underwater after 2011.
Gold when interest rates are high
The textbook rule is simple: gold pays no interest, so when cash and bonds pay well in real terms — after inflation — the opportunity cost of holding gold rises and the price should fall. The history is more interesting than the rule.
| Period | Rates | Gold | Why |
|---|---|---|---|
| 1971 – 1980 | Rising, but below inflation | US$35 → US$850 | Negative real rates, end of the gold standard |
| 1980 – 1982 (Volcker) | Fed funds near 20%, far above inflation | −65% to US$298 | Strongly positive real rates |
| 2022 – 2024 | Fed to 5.25–5.50%, real yields positive | Record highs | Central banks bought >1,000 t a year |
| 2026 | Fed hikes; US 10-yr real yield 2.95% peak | −27% from record | Rates matter again; speculative money left |
The lesson is that nominal rates do not matter much; real rates and who is buying do. In the 1970s rates rose all decade, but inflation rose faster, so cash lost money in real terms and gold soared. Under Paul Volcker real rates went sharply positive and gold lost two-thirds of its value. Between 2022 and 2024 real rates went positive again, and gold should have fallen — instead it set records, because the marginal buyer was a central bank diversifying away from the US dollar, not an investor weighing the yield on a Treasury bond.
2026 is a partial return to the old rule. As US real yields climbed to their highest since 2008, gold fell 27%. Central banks kept buying, but the speculative and momentum money that drove the January peak left. That split is useful for an investor: it suggests central-bank demand set a higher floor than the old model allows, while rate expectations still set the swings.
What this means in Australia, now
The Reserve Bank lifted the cash rate to 4.85% on 3 November 2026, effective the next day — its fifth increase this year (February, March, May, September and November) from 3.60%, and the highest since 2008. Headline inflation was 4.3% in the year to September and the trimmed mean 3.6%, so the real cash rate is now positive on the RBA's preferred measure. Term deposits paying over 5% are a genuine competitor for gold for the first time in more than a decade. That is a headwind. The tailwind is that high rates in Australia have pushed the dollar up, which has made gold cheaper for Australians to buy than the US-dollar chart suggests. We look at where rates may go in our five-year interest-rate forecast.
Nominal rates do not move gold much. Real rates and who is buying do.
Gold in stagflation
Stagflation — high inflation with weak growth and rising unemployment — is the environment gold has historically liked best. The World Gold Council's 2021 study of US data from 1973 to 2021 classified 68 of 201 quarters as stagflationary. In those quarters gold returned an average of 32.2% a year, ahead of commodities (17.5%) and Treasuries (9.6%), while US shares lost 6.6%. Restricting the data to the last twenty years of that sample, gold still averaged 14.7% against −5.6% for shares.
Australian data tells the same story. State Street found that from 2000 to June 2026, in periods when Australian inflation ran above 3%, gold returned 16.6% a year after inflation in Australian dollars, against 5.1% for bonds and just 0.2% for Australian shares. In the classic stagflation episode of 1973–74, US shares fell roughly 45% while gold nearly tripled.
Two warnings. First, these are averages built heavily on the 1970s, when gold had just been freed from a fixed price and was starting from a very low base. Second, the worst stagflation outcome for gold is the Volcker one: if a central bank raises rates far enough above inflation to break it, gold falls even while the economy suffers.
Australia now has the ingredients. Inflation is 4.3% and rising, unemployment rose to 4.7% in September as employment fell by 39,000, growth per person has stalled, and the RBA is still tightening. Our analysis of whether Australia is heading for recession or stagflation calls it "not a recession, not yet" — a stagflation-lite. If that hardens into the real thing, history says gold is the asset most likely to hold its value. If the RBA and Fed instead push real rates high enough to crush inflation, 2026's fall is the template.
Are central banks still buying?
Yes — and faster this year than last. This is the single most important fact in the gold market, because central banks are the buyer that broke the old link between gold and interest rates.
From 2010 to 2021 central banks added an average of 473 tonnes a year. In 2022, the year Western governments froze about half of Russia's US$600 billion-plus of foreign reserves, purchases more than doubled to 1,082 tonnes, and stayed above 1,000 tonnes in 2023 and 2024. They eased to 863 tonnes in 2025 as prices soared, but in the first nine months of 2026 they reached 675 tonnes, 6% ahead of the same period last year. The September quarter alone was 321 tonnes, up 42% on a year earlier and well above the five-year quarterly average of 227 tonnes. The World Gold Council expects the 2026 total to at least match 2025.
| Buyer | What it has done |
|---|---|
| Poland (NBP) | Largest buyer of 2025 (102 t); another ~122 t in 2026 to September, heading for a 700 t target |
| China (PBoC) | Reported buying for 23 straight months to September 2026; holds 77.47 Moz (about 2,410 t) |
| Kazakhstan, Uzbekistan | Steady buyers every quarter of 2026 |
| Czech Republic | Building towards 100 t by 2028 |
| Turkey, Russia | Net sellers in 2026 — Turkey to defend its currency, Russia to fund its budget |
| Reserve Bank of Australia | 80 t, unchanged since 1997; not a buyer |
World Gold Council Gold Demand Trends Q1–Q3 2026; PBoC data via Kitco; RBA.
The intentions are as striking as the numbers. In the World Gold Council's 2026 survey of 76 central banks (published 16 June 2026), a record 45% said they planned to increase their own gold reserves over the next year, 84% expected gold's share of global reserves to be higher in five years, and 74% expected the US dollar's share to be lower. Their reasons were crisis performance, store of value and diversification — which in plain language means not wanting reserves that another government can freeze.
The European Central Bank reported in June that gold made up about 27% of global official reserves at the end of 2025, overtaking US Treasuries (22%) and the euro (15%). Read that one carefully: the ECB itself says the jump is largely valuation. At end-2023 prices, gold's share would have been about 16%.
Central-bank data is murky. In the September quarter only about 120 of the 321 tonnes were publicly reported; the rest is the Council's estimate of unreported buying. Its first-quarter 2026 figure was cut from 244 tonnes to 58 tonnes in a July correction. Central banks can also sell — Turkey and Russia did this year, and Bank of America has warned more could. A floor built on official buying is real, but it is not guaranteed.
Is supply keeping up with demand?
Barely, and only because the price is doing the rationing.
Supply: almost flat
Mines produced a record 3,672 tonnes in 2025, but mine output has grown by less than 1% a year on average over the past decade. Production hit another quarterly record in the September quarter of 2026 (1,071 tonnes) and is up about 2% this year. Add recycled gold — 1,404 tonnes in 2025, a 13-year high as owners sold jewellery into record prices — and total supply was 5,002 tonnes. Each year's new mining adds only about 1.7% to the roughly 220,000 tonnes already above ground.
Australia matters here. It is the world's third-largest producer on US Geological Survey figures (about 280 tonnes in 2025; industry consultant Surbiton Associates puts it at 303 tonnes, worth about A$54 billion), with around 13,000 tonnes of reserves. But Australian output fell 12% year on year in the September quarter.
Why more supply is slow to come
- Discoveries have dried up. S&P Global counts only nine major gold discoveries (2 million ounces or more) from 2020 to 2025, and none at all in 2023 or 2024.
- Mines take a generation to build. The average time from discovery to production is 15.7 years across 127 mines, and almost 18 years for mines that started between 2020 and 2023.
- Costs are rising fast. Average AISC rose 22% in a year to a record US$1,930 an ounce in the June quarter of 2026, and ore grades are lower than in 2010.
Demand: record value, falling volumes
| Demand, first nine months of 2026 | Tonnes | Change |
|---|---|---|
| Jewellery | 889 | −19% |
| Bars and coins | 1,053 | Best start since 2013 |
| ETFs (Q3 inflows) | 211 | Record US$31bn in Q3; holdings a record 4,256 t |
| Central banks | 675 | +6% |
| Total demand incl. OTC | 3,881 | In line with 2025's record pace; value a record US$566bn |
World Gold Council, Gold Demand Trends Q3 2026 (3 November 2026).
The picture is of a market where supply cannot respond quickly, so the price rises until the most price-sensitive buyers — jewellery buyers in India and China — step back. Jewellery volumes are at the lowest since the Council's series began in 2000. Meanwhile investors and central banks absorb the rest. Supply is "keeping up" only in the sense that a higher price has destroyed enough demand to balance the books. That is bullish for the long run and says little about next quarter.
One honest caveat: about 18% of 2026 demand sits in the Council's "OTC and other" line, which is simply the gap between measured supply and measured demand. A big chunk of the market is, in effect, unexplained.
Should a portfolio include gold?
The evidence for a small allocation is stronger than the evidence for a big one. Gold's case in a portfolio is not that it beats shares — over most long periods it does not — but that it tends to hold up when shares fall hardest.
- In the 14 falls of more than 15% in US shares from 1987 to June 2026, gold rose in 11, averaging +5.9% while the S&P 500 averaged −23.7% (State Street).
- During the global financial crisis gold rose about 21% in US dollars from December 2007 to February 2009. In 2022, when both shares and bonds fell, gold was roughly flat while the S&P 500 lost 19%.
- The World Gold Council's 2026 analysis found adding 5% gold to a typical US portfolio over 2005–2025 lifted returns from 6.7% to 7.0% a year and cut the worst drawdown from −34.9% to −32.7%. Its earlier Australian super study found 5% gold lifted returns and cut the worst drawdown from −31.4% to −26.2% (2001–2021).
| Who | Suggested gold allocation |
|---|---|
| Morningstar (Amy Arnott, Jan 2026) | 5% or less |
| State Street (Jul 2026) | 2–5% |
| World Gold Council | Rises with the riskiness of the portfolio; 5% used as its standard example |
| Ray Dalio (Oct 2025 – Aug 2026) | 10–15% |
| Morgan Stanley CIO Mike Wilson (Sep 2025) | 20% (a "60/20/20" mix with Treasuries) |
The counter-case deserves weight. In his 2011 letter to Berkshire shareholders, Warren Buffett pointed out that all the world's gold could buy all of America's farmland plus sixteen ExxonMobils, with a trillion dollars to spare — and that a century later the farms and companies would have produced enormous output and dividends while the gold would still be the same lump of metal. That is the cost of gold: no income, no compounding. And 2026 showed its limits as insurance — in a rate shock, gold fell alongside speculative shares, and on 30 October it was sold to meet margin calls.
Insurance against war and hyperinflation
The oldest argument for gold has nothing to do with returns. Gold is the one financial asset that is nobody else's liability: it cannot be printed, defaulted on or frozen by a foreign government, and it is accepted as money almost everywhere. That matters most in the two situations an ordinary portfolio handles worst — the collapse of a currency and war.
Hyperinflation. In Weimar Germany the mark went from 4.2 to the US dollar in 1914 to about 4.2 trillion by November 1923. A loaf of bread in Berlin that cost about 160 marks at the end of 1922 cost about 200 billion marks a year later, and savings, bonds and mortgages written in marks were all but wiped out. Gold, fixed at US$20.67 an ounce, simply rose in marks by the same trillion-fold — to roughly 87 trillion marks an ounce on richer.au's arithmetic — so a household that held gold kept its purchasing power while one that held cash lost almost everything. When the currency was replaced in November 1923, twelve zeros were struck off prices. Zimbabwe, where monthly inflation reached an estimated 79.6 billion per cent in November 2008 on economist Steve Hanke's calculation, and Venezuela, where inflation ran into the hundreds of thousands of per cent in 2018, taught the same lesson: savings survived in real assets and foreign currency, not in the local banking system.
War and geopolitical shocks. The World Gold Council's study of the Geopolitical Risk Index from 1999 to 2024 found that in weeks when the index jumped by 100% or more, gold rose 1.6% on average while global shares fell 0.8%, and gold was positive in almost every one of those weeks. It estimates each 100-point rise in the index has added about 2.5% to the gold price. The central-bank rush into gold after Russia's reserves were frozen in 2022 is the same instinct at national scale. For families, history is starker: in wars, occupations and revolutions, gold coins and jewellery have often been the only wealth that could be carried across a border when bank accounts were frozen and paper money was worthless.
War does not automatically lift gold. After Russia invaded Ukraine, gold came within a few dollars of its then record of about US$2,070 in early March 2022, then fell almost 20% by late September as the Fed raised rates. In October 2026, an oil shock from the Iran conflict pushed bond yields up and gold down. In the short run, interest rates usually beat fear.
Governments can restrict gold in a crisis. US Executive Order 6102 (5 April 1933) required Americans to hand in gold holdings above US$100 at US$20.67 an ounce; the dollar was then devalued to US$35, and private ownership was not legal again until 31 December 1974. Australia had its own controls: from wartime regulations in 1939, and later under Part IV of the Banking Act, newly acquired gold had to be delivered to the Reserve Bank and coin holdings were capped, until the restrictions were suspended on 30 January 1976.
The form of gold matters. An ETF or a pool-allocated account is a claim on metal in a vault — often in London — and relies on the issuer, the custodian and the financial system still working. Bars and coins in your own possession avoid that, but bring storage, insurance, theft and authenticity risks, and a one-kilogram bar (about A$181,000 at today's price) is hard to spend. Small coins cost more per ounce but are far more usable in an emergency.
Size it to the risk. Australia has never had a hyperinflation, and the RBA has an inflation target. Insuring against an unlikely catastrophe justifies a modest allocation, not a large one.
Treat gold as insurance, not as an investment you expect to make you rich. Insurance is sized by what you are protecting, not by what you hope to win: for most diversified investors that has meant somewhere in the 5–10% range, rebalanced once a year so that a rally is trimmed and a fall is topped up. Rebalancing is what turns gold's volatility into a return. Holding much more than that is a bet on a particular future — usually stagflation or a monetary crisis — and should be recognised as one. This is general information, not personal advice; your own allocation depends on your situation. Our money management rules explain why the 'never be a forced seller' principle matters more than any single asset.
Gold is insurance. Size it by what you are protecting, not by what you hope to win.
The ASX gold miners
Australia has one of the deepest lists of listed gold producers anywhere. Miners are not the same as gold: they carry operating leverage, costs, management and country risk. When gold rises they usually rise faster, and when it falls they usually fall harder. The table shows the main producers on the ASX, with their FY27 guidance (most published July 2026).
| Company (ticker) | Market cap* | FY27 guidance (oz) | FY27 AISC guidance | Worth knowing |
|---|---|---|---|---|
| Newmont (NEM, CDIs) | ~A$163bn | ~5.9Moz (CY26) | US$1,545 (Sep qtr) | World's largest; Cadia, Boddington, Tanami; net cash US$3.2bn |
| Northern Star (NST) | ~A$34bn | 1.50–1.65M | A$3,050–3,450 | Largest ASX-domiciled; KCGM mill expansion commissioning; Hemi decision late FY27 |
| Evolution (EVN) | ~A$24bn | 660–730k + copper | A$1,795–1,995 | Lowest-cost major thanks to copper credits; net cash; yield ~3.5% |
| Perseus (PRU) | ~A$7.7bn | 420–480k | US$1,835–2,070 | US$900m cash, no debt; buy-back; West Africa and Tanzania |
| Genesis (GMD) | ~A$7.5bn | 270–300k (stand-alone) | A$2,750–3,050 | Merging with Vault (implementation 26 Nov 2026) for 600–700koz a year |
| Greatland (GGP) | ~A$6.4bn | 260–300k | A$2,900–3,330 | Telfer and Havieron; A$1.3bn cash |
| Ramelius (RMS) | ~A$6.3bn | 205–225k | A$2,150–2,350 | Mt Magnet expansion; costs jumped in the Sep quarter |
| Capricorn (CMM) | ~A$5.8bn | 137–147k | A$1,900–2,100 | Low-cost Karlawinda, expanded; Mt Gibson in development |
| Vault (VAU) | ~A$5.5bn | 355–375k | A$3,150–3,350 | Highest-cost in the group; being absorbed into Genesis |
| Westgold (WGX) | ~A$5.0bn | 385–425k | A$2,980–3,380 | No debt, unhedged, A$1bn treasury; reserves up 41% |
| Regis (RRL) | ~A$4.7bn | 360–400k | A$2,990–3,390 | Highest yield (~4.8%); McPhillamys blocked by court ruling |
| Emerald (EMR) | ~A$4.0bn | 100–115k | US$980–1,080 | Very low cost; Okvau in Cambodia |
| West African (WAF) | ~A$3.8bn | 430–490k (CY26) | under US$1,900 | Burkina Faso decree lifts state stake in Kiaka to 40% |
| Bellevue (BGL) | ~A$2.1bn | 150–170k | A$2,800–3,100 | Hedge book still capping cash flow |
*Approximate, from closing prices on 30 October – 2 November 2026. Guidance from company ASX releases and September 2026 quarterly reports. Newmont figures are US$ and calendar-year.
Which is "best" depends on what you want
- Size and liquidity: Northern Star and Evolution (and Newmont's CDIs) are the core holdings of most gold funds and the easiest to trade.
- Lowest cost: Evolution, Capricorn and Ramelius among the Australian-dollar producers; Emerald on US-dollar costs. Low cost is what protects you if gold keeps falling.
- Balance sheet: Perseus, Westgold and Greatland have large cash piles and no meaningful debt.
- Income: Regis and Evolution pay the highest dividends, mostly franked.
- Growth: Genesis–Vault, Northern Star's KCGM expansion and Perseus's Nyanzaga (first gold due January 2027).
- Higher risk: high-cost producers, single-mine companies, and anyone operating in West Africa or Cambodia, where governments have been raising royalties and taking larger stakes.
Operating leverage cuts both ways. On richer.au's calculation, a further 10% fall in gold from A$5,633 would cut Evolution's margin per ounce by about 15% but Northern Star's and Vault's by about 24%. That is why the cheapest miners are not always the best value in a falling market. Selecting individual miners is stock-picking; for most investors a fund of them, below, is simpler.
ASX gold ETFs and bullion
If the aim is gold itself rather than miners, an exchange-traded product is the cheapest and simplest route. The main choices:
| Fund | Fee p.a. | Size | What you own | Currency |
|---|---|---|---|---|
| Global X Gold Bullion (GXLD) | 0.14% | A$775m | Physical gold, London vault | Unhedged |
| VanEck Gold Bullion (NUGG) | 0.14% | A$264m | Australian-origin bars at the Perth Mint | Unhedged |
| Perth Mint Gold (PMGOLD) | 0.15% | A$2.4bn | Gold backed by the WA Government guarantee | Unhedged |
| Global X Physical Gold (GOLD) | 0.40% | A$5.4bn | Physical gold, London vault; the largest and oldest | Unhedged |
| Global X Gold Bullion hedged (GHLD) | 0.35% | A$229m | Physical gold | Hedged to A$ |
| BetaShares Gold Bullion (QAU) | 0.59% | A$1.1bn | Physical gold, London vault | Hedged to A$ |
| VanEck Gold Miners (GDX) | 0.53% | ~A$1.3–1.5bn | About 114 global gold miners | Unhedged |
| BetaShares Global Gold Miners (MNRS) | 0.57% | A$225m | Global gold miners | Hedged to A$ |
Issuer websites, 30 September – 3 November 2026.
The hedging choice matters more than the fee. An unhedged fund gives you gold plus a bet against the Australian dollar, which historically softens gold's falls: the dollar tends to drop in a crisis, when gold rises. A hedged fund gives you the US-dollar gold price. Over the year to September 2026 the hedged QAU returned 8.7% while the unhedged funds returned roughly 2% or less, because the Australian dollar rose. Over longer periods the unhedged version has been the smoother ride for Australians.
For physical metal, the Perth Mint's depository and private dealers such as ABC Bullion and Ainslie sell bars and coins and can store them. Expect to pay a premium over spot: on 4 November a one-ounce Perth Mint minted bar was about 3.2% over spot at one large dealer, and a one-ounce Kangaroo coin about 4.3%. Add the dealer's discount when you sell back, and the round trip on small coins and bars can cost several per cent — far more than an ETF. Larger cast bars and pool-allocated accounts are cheaper. Always get a live buy-and-sell quote before you commit. Our silver guide covers storage, insurance and allocated versus unallocated holdings in more detail.
Tax: GST, CGT and the 2027 change
- GST: investment gold of at least 99.5% purity in bar, wafer or coin form traded at the spot price is GST-free on first sale and input-taxed after that, so investors pay no GST (ATO ruling GSTR 2003/10). Jewellery and numismatic coins are not covered.
- Capital gains: bullion, gold ETFs and miners' shares are all CGT assets. Until 30 June 2027, individuals holding for more than 12 months get the 50% CGT discount.
- From 1 July 2027: under the Treasury Laws Amendment (Tax Reform No. 1) Act 2026, the 50% discount is replaced for individuals, trusts and partnerships by indexation of the cost base for inflation plus a 30% minimum tax on real gains. Gains built up before 1 July 2027 keep the old treatment; the value at that date is worked out when you sell. This covers gold ETFs and physical bullion as well as property and shares. Super funds have separate rules.
- Collectables: coins and medallions held mainly for personal use or enjoyment are collectables, whose losses can only offset collectable gains. Bullion coins bought purely as an investment are generally treated as ordinary CGT assets, but numismatic value can change that — another reason many investors prefer bars or ETFs.
Get advice on your own situation; the 2027 change makes the timing of sales more important than usual.
What analysts are predicting
Almost every major forecaster expects gold to be higher in 2027 than today. Almost every one of them has also cut their forecast at least once in 2026.
| Forecaster | Forecast (US$/oz) | Date |
|---|---|---|
| Goldman Sachs | End-2026 4,650; end-2027 5,400 | Sep 2026 (cut from 5,400, then 4,900) |
| J.P. Morgan | Q4 2026 average 4,500 | Jul 2026 (cut from ~6,000) |
| Bank of America | Q4 2026 average 4,000; 2027 average 4,813 | 12 Oct 2026 |
| HSBC | 2026 average 4,490; 2027 average 4,825 | 1 Oct 2026 |
| UBS | Dec 2026 4,600; Sep 2027 5,400 | Jul 2026, reaffirmed Oct |
| Morgan Stanley | Back above 5,000 in H2 2027; 4,000 a strong floor | 30 Sep 2026 |
| Citi | 6–12 months 5,000 | 25 Aug 2026 |
| Deutsche Bank | Q4 2026 4,600 | Aug 2026 |
| CIBC | 2027 average 5,200 | 20 Oct 2026 |
| ANZ | End-2026 4,600; 12-month 5,400 | 15 Jul 2026 |
| Macquarie | End-2026 4,300; 2027 average 4,200, lower each year to 2030 | 26 Jun 2026 |
| World Bank | 2026 average 4,600; 2027 average 4,250 | 28 Oct 2026 |
| Office of the Chief Economist (Australia) | 2026 average 4,600; about 3,760 by 2031 in real terms | Resources and Energy Quarterly, Sep 2026 |
| Reuters poll (30 analysts) | 2026 median 4,495; 2027 median 4,650 | 27 Oct 2026 |
| Incrementum (In Gold We Trust) | 8,900 by 2030 in its inflationary scenario; 4,822 probability-weighted | 20 May 2026 |
| Capital Economics (bear) | 3,500 by end-2026; called the rally a late-stage bubble | Oct 2025 |
Bank forecasts as reported by Reuters, Kitco, Mining.com and TheStreet; several (UBS, CIBC, Macquarie, ANZ, World Bank, OCE) are from secondary reports and should be checked against the original note.
Read forecasts as a map of opinion, not a prediction. In January the LBMA's survey of 28 analysts averaged US$4,742 for 2026, with a range from US$3,450 to US$7,150; several banks lifted targets towards US$6,000 near the peak and cut them through the year as the price fell. Forecasts tend to follow the price. The more useful signal is the spread: the Australian Government's own resource forecaster and Macquarie expect gold to drift lower in real terms over the rest of the decade, while most global banks see today as a pause in a longer bull market. The median view — about US$4,650 for 2027, 18% above today — is a modest recovery, not a return to the record.
The case against gold
- Cash pays again. With the RBA at 4.85% and US real yields near 2.6%, holding a metal that pays nothing has a real cost for the first time in years.
- Miners have every reason to dig. At twice the cost of production, record margins will fund expansions and restarts. Supply is slow, but not frozen.
- Jewellery buyers have walked away. Volumes are the lowest on record. If investment and central-bank demand slows, there is less underneath.
- Record ETF holdings are also potential sellers. Holdings reached a record 4,256 tonnes in September — a lot of investors who bought high and may sell into weakness.
- Central banks are not a guarantee. Much of their buying is unreported, estimates get revised heavily, and some are already selling.
- History is unkind after manias. The last two parabolic peaks, 1980 and 2011, were followed by falls of 45–70% and many years underwater.
Conclusion: underpriced, or just less overpriced?
On the evidence, gold at US$3,929 (A$5,633) is not underpriced by any long-run historical measure. It is above its 1980 peak in real terms, twice what it costs to produce, and far above where the old interest-rate model says it should be. Anyone calling it "cheap" is really saying that the last three years have changed the rules.
They may be right. The buyer that broke those rules — central banks protecting themselves against sanctions and a weaker dollar — is buying more this year than last, and says it intends to keep going. Mine supply barely grows and new discoveries have nearly stopped. Australia is drifting towards the kind of high-inflation, weak-growth economy in which gold has historically done best. And after a 27% fall the price sits below almost every major forecaster's view of 2027.
So the fairest answer is this: gold is better value than it was in January, and fairly priced if central-bank demand holds — but it is not a bargain, and the 2026 fall shows rates still have the power to push it lower. That makes it a sensible thing to own in moderation, as insurance in a diversified portfolio, rebalanced over time. It makes it a poor thing to bet heavily on.
For most Australians the practical choices are simple: a low-fee unhedged ETF for the metal, a miners' fund if you want more leverage, and individual miners only if you are prepared to research costs, balance sheets and country risk. Gold will not make you Richer on its own. Held sensibly, it can stop a bad year from making you poorer. Invest Smarter. Live Richer.
Frequently asked questions
Is gold underpriced right now?
Not by long-run history. At about US$3,929 an ounce (A$5,633) on 3 November 2026, gold is roughly 7% above its 1980 peak in real terms and about twice the industry's average cost of production. It is, however, 27% below its January 2026 record and below most banks' 2027 forecasts, so it is better value than it was earlier in the year.
Why has the gold price fallen in 2026?
Mainly rising interest rates. US inflation re-accelerated, the Federal Reserve raised rates in September 2026, US real bond yields hit their highest since 2008 and the US dollar strengthened. Speculative money that drove the January peak left, and gold was sold to meet margin calls during an October sell-off in technology shares.
Is gold a good investment when interest rates are high?
It depends on real interest rates — rates after inflation. Gold soared in the 1970s when rates were high but below inflation, and fell 65% under Paul Volcker when real rates were strongly positive. From 2022 to 2024 gold rose despite positive real rates because central banks were buying. In 2026 rising real rates have pushed it lower again.
Does gold do well in stagflation?
Historically, yes. The World Gold Council found gold returned an average of 32.2% a year in stagflationary quarters from 1973 to 2021, while US shares lost 6.6%. In Australia, State Street found gold returned 16.6% a year after inflation when CPI was above 3% between 2000 and 2026. The exception is when central banks raise rates far above inflation.
Does gold protect against war or hyperinflation?
Historically it has held its value when currencies collapsed: in Weimar Germany in 1923 the mark lost almost all its value against the dollar while gold kept its purchasing power. The World Gold Council found gold rose in almost every week of sharp geopolitical stress between 1999 and 2024. But gold can fall during wars when interest rates rise, as in 2022 and 2026, and governments have restricted private gold ownership in crises, including in Australia until 1976.
Are central banks still buying gold?
Yes. Central banks bought 675 tonnes in the first nine months of 2026, 6% more than a year earlier, after more than 1,000 tonnes a year from 2022 to 2024. Poland and China are the most consistent buyers, while Turkey and Russia have been selling. The Reserve Bank of Australia holds 80 tonnes and has not bought since 1997.
How much gold should be in a portfolio?
Published views range from 2–5% (State Street) and 5% or less (Morningstar) to 10–15% (Ray Dalio). Research suggests a small allocation of around 5–10%, rebalanced regularly, has historically reduced portfolio drawdowns without a large cost to returns. The right amount depends on your circumstances; this is general information, not personal advice.
What are the biggest ASX gold stocks?
By market value, Newmont (via CDIs), Northern Star, Evolution, Perseus, Genesis, Greatland, Ramelius, Capricorn, Vault and Westgold. Evolution and Capricorn are among the lowest-cost producers; Perseus, Westgold and Greatland hold large net cash balances; Regis pays the highest dividend yield.
What is the cheapest way to buy gold in Australia?
An ASX-listed gold ETF is usually cheapest: Global X Gold Bullion (GXLD) and VanEck Gold Bullion (NUGG) charge 0.14% a year and Perth Mint Gold (PMGOLD) 0.15%, plus brokerage. Physical coins and small bars carry dealer premiums of several per cent over spot and a discount when you sell back.
How is gold taxed in Australia?
Investment-grade gold of at least 99.5% purity is free of GST. Gains on bullion, gold ETFs and gold shares are subject to capital gains tax. The 50% CGT discount applies until 30 June 2027; from 1 July 2027 it is replaced for individuals, trusts and partnerships by indexation plus a 30% minimum tax, with gains to that date keeping the old treatment.
Sources
Figures are as at the dates shown. Where sources disagreed, the primary source is used and the conflict noted in the text. Some bank forecasts are from press reports of research notes not publicly available.
- World Gold Council — Gold Demand Trends Q3 2026 (3 Nov 2026), including the central banks, supply, investment, jewellery and outlook sections.
- World Gold Council — Gold Demand Trends Full Year 2025: central banks
- World Gold Council — Central Bank Gold Reserves Survey 2026 (16 Jun 2026)
- World Gold Council — Gold Market Commentary, September 2026 (record LBMA PM prices, US$ and A$)
- World Gold Council — Gold Market Commentary, December 2025 (2025 returns)
- World Gold Council — How much gold has been mined?
- World Gold Council — Record gold prices outpace rising mining costs (Aug 2026)
- World Gold Council — Stagflation rears its ugly head (Oct 2021)
- World Gold Council — Gold as a strategic asset 2026: portfolio impact
- World Gold Council — Gold's role in Australian super funds
- State Street Global Advisors — Gold for Australian investors (Jul 2026)
- Vanguard Australia — Index Chart 2026 (20 years to 30 Jun 2026)
- Livewire — Long-Term Investing Report 2025
- Cotality — Home Value Index, November 2026
- Perth Mint — Historical metal prices
- Guardian Gold — Overnight precious metals summary, 4 Nov 2026
- Reserve Bank of Australia — Exchange rates and Monetary policy decision, 3 Nov 2026
- Reserve Bank of Australia — Gold holdings
- ABS — CPI rose 4.3% in the year to September 2026 and unemployment 4.7% in September
- Federal Reserve — FOMC statement, 28 Oct 2026
- FRED — 10-year TIPS yield, M2 money supply and BLS CPI
- RBC Wealth Management — Gold's regime change (Jun 2025)
- Metalcharts — S&P 500 to gold ratio and Perth Mint on the ratio's history
- SIFMA — 2026 Capital Markets Fact Book and IIF global debt, Sep 2026
- Incrementum — In Gold We Trust 2026
- Kitco — ECB report on gold's share of reserves (2 Jun 2026)
- Kitco — PBoC September 2026 purchases
- US Geological Survey — Mineral Commodity Summaries 2026: Gold
- S&P Global — Major gold discoveries remain scarce (Oct 2026) and discovery-to-production lead times
- Mining Weekly — Surbiton Associates on Australian gold output (Aug 2026)
- Morningstar — Gold keeps reaching new heights (Jan 2026)
- Fortune — Ray Dalio on gold allocation and Kitco — Morgan Stanley's 60/20/20
- Berkshire Hathaway — 2011 shareholder letter
- Company ASX releases and September 2026 quarterly reports: Northern Star, Perseus, Westgold; others via ASX announcements; Newmont via Kitco
- ETF issuers: Global X GOLD, GXLD, Perth Mint PMGOLD, BetaShares QAU, MNRS, VanEck NUGG, GDX
- Mining.com — Bank of America forecast; TheStreet — HSBC; Kitco — Morgan Stanley; Yahoo Finance — J.P. Morgan; LBMA Forecast Survey 2026; Capital Economics
- Firstlinks — World Gold Council (Ray Jia) on gold and geopolitical risk (Oct 2024)
- Hyperinflation in the Weimar Republic and Johns Hopkins Magazine — Steve Hanke on Zimbabwe
- Executive Order 6102 and history of gold controls in Australia (reproducing the Treasurer's statement of 30 Jan 1976)
- ABC7 — gold down almost 20% from its March 2022 peak (24 Sep 2022)
- ATO — GSTR 2003/10 (precious metals)
Keep reading
James Zhang writes richer.au's Property, Shares, Commodities and Wealth coverage. He has invested through more than two decades of Australian market cycles — including the 2008 crisis, the 2011–15 commodities bust, the 2020 recession and the 2022–23 hiking cycle — across residential, commercial and development property and listed markets.
General information only. This article is general information, not personal financial, investment, taxation or legal advice, and doesn't account for your objectives, financial situation or needs. Valuation verdicts and margin calculations are the author's analysis of published figures, not forecasts. Forecasts quoted are those organisations' opinions at the dates shown and change without notice. Mention of a company or fund is not a recommendation to buy or sell it. Figures are sourced and dated as shown and can change. Past performance is not a reliable indicator of future performance. Richer Online Pty Ltd (ABN 62 159 604 949) does not hold an Australian Financial Services Licence and has no commercial relationship with any company or fund mentioned. Read the Terms of Use or get in touch.
Get richer, one decision at a time
New articles as they land.
Property, shares, commodities and tax strategy — worked examples with real Australian figures and no product spruiking. One email when something new goes live.
No spam · unsubscribe any time