2400 · Listed property
Listed property is on sale. Is it cheap?
The 20 largest ASX REITs compared on yield, P/E, price-to-NTA, payback years and what the brokers think — plus how four rate rises got here, and whether a REIT beats buying a property outright.
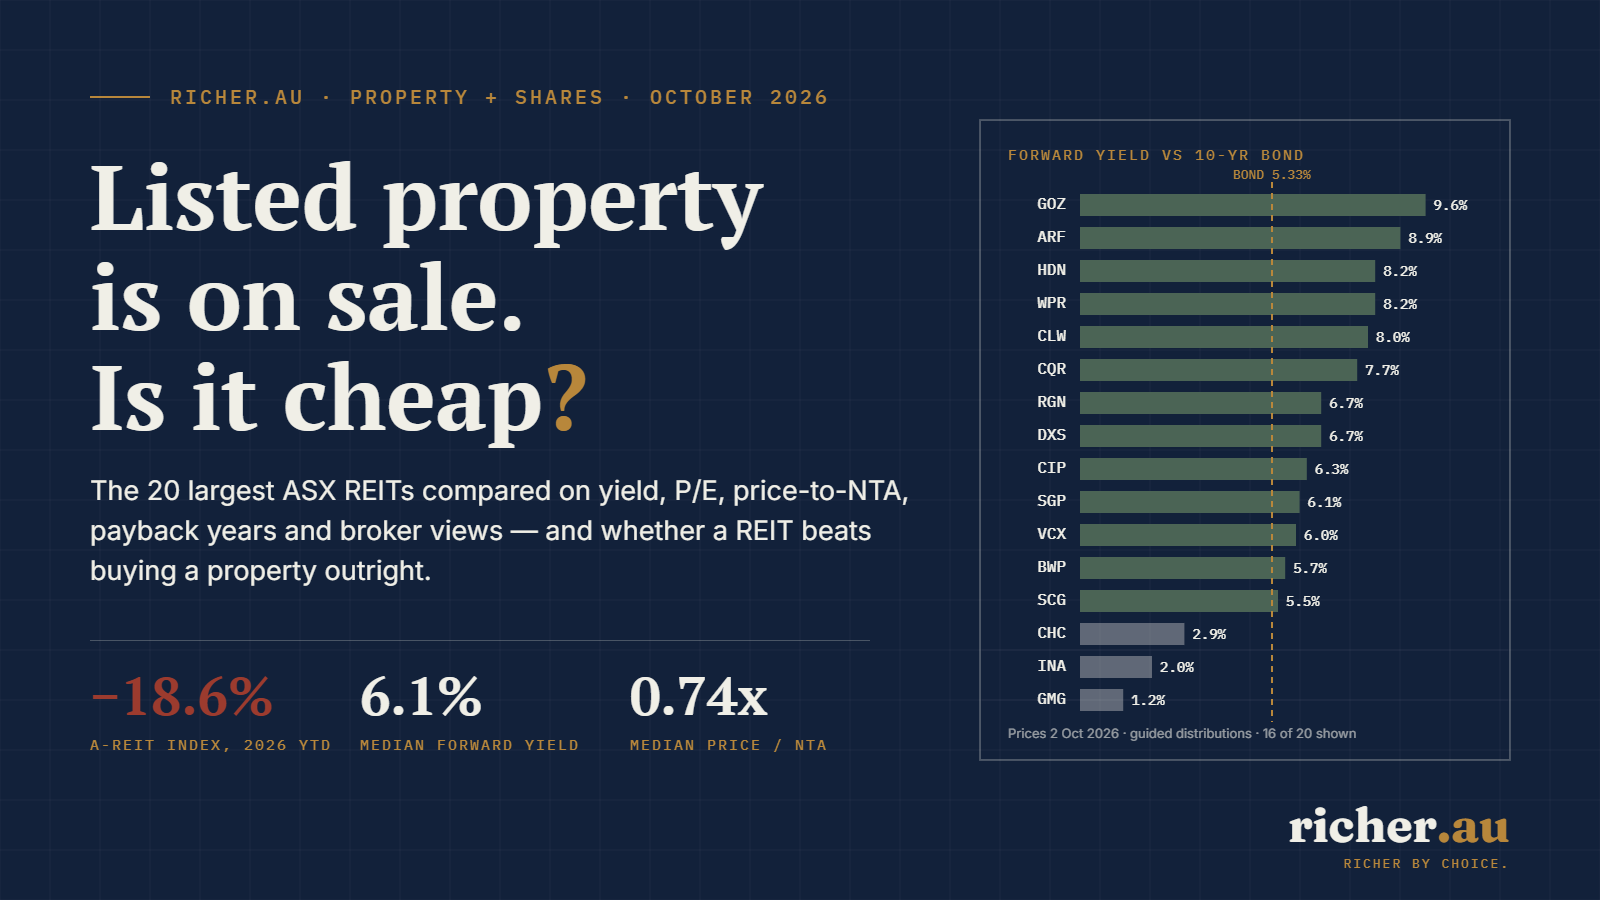
Twenty landlords, one question: does the price pay you back?
Australian listed property has had the worst year of any major corner of the ASX. The S&P/ASX 200 A-REIT index closed at 1,480 on 2 October 2026, down 18.6% for the year while the broader ASX 200 is slightly up. Four Reserve Bank rate rises took the cash rate from 3.60% to 4.60%, the ten-year government bond went from about 4.3% to 5.33%, and a sector that is priced off those two numbers was repriced accordingly. Seventeen of the twenty largest real estate investment trusts now trade below the stated value of the buildings they own. Six hit 52-week lows this week.
That is either the clearance sale of the decade or a sensible mark-down of assets that were worth less than their owners claimed. This article does not pick one answer for all twenty. It lines them up on the measures that matter for an income investor — distribution yield, price-to-earnings, price-to-net-tangible-assets, gearing, and the number of years of distributions it takes to get your purchase price back — then sets out what the brokers and Morningstar think each one is worth, works through how interest rates move these prices, and finishes with the question most readers actually have: would this money do better in a property you own outright? Every figure is dated and sourced, because in this sector a number from August is already stale.
- Why 2026 has been a sea of red for listed property
- The 20 largest A-REITs at a glance
- Yield, P/E and price-to-NTA, side by side
- How many years of distributions repay the price
- What the experts say each one is worth
- Is now a good time to buy?
- How interest rates move REIT prices
- Listed REITs or a property of your own?
- The Richer verdict
- Frequently asked questions
Why 2026 has been a sea of red for listed property
A year ago the script said rates were falling. The RBA had cut three times in 2025 and the A-REIT index returned 10.3% in the 2025 financial year. Then inflation came back — energy prices after the Middle East conflict, a stronger private economy, trimmed-mean inflation stuck at 3.6% — and the Bank reversed course on 3 February 2026 with the first rise since 2023. Three more followed on 17 March, 5 May and 29 September. The ten-year bond, which was about 4.6% in January, cleared 5% by late March and was 5.33% on 2 October.
Why does a bond yield matter so much to a landlord? Because a building is valued by capitalising its rent at a yield, and that yield is the bond yield plus a premium for risk. When the risk-free rate rises a full percentage point and rents cannot rise that fast, the only way for the arithmetic to balance is for the building to be worth less. A trust with 30% gearing feels that fall at roughly 1.4 times on its equity. On top of that, the cheap pre-2022 debt is rolling off: Mirvac's weighted cost of debt is 5.7%, HomeCo Daily Needs expects its to rise from 5.0% to 5.5% this year, and that comes straight out of distributable earnings.
Three other things were specific to 2026. Goodman Group, which alone is more than a third of the index, fell with global data-centre sentiment and guided to 9% growth when the market wanted 11%. The May Budget's negative gearing and capital gains changes hit the developers — Stockland and Mirvac — through weaker investor demand for new housing. And superannuation money kept drifting out of listed property into unlisted and global alternatives, so there was no natural buyer on the way down.
Most of these trusts hedge most of their debt. Dexus has 91% hedged at 3.0%, Region Group 100%, Waypoint 95%, Charter Hall Long WALE 85%. Hedging protects this year's distribution; it does not protect the share price, because the price is set by what a buyer today would pay for the buildings at today's bond yield. That is why distributions across the sector mostly held or grew in FY26 while prices fell 20% or more.
The 20 largest A-REITs at a glance
The comparison covers the twenty largest listed property trusts by market capitalisation on the ASX at 2 October 2026, as ranked by Market Index. Pure developers (Lendlease, Peet), funds managers without a stapled property trust (Centuria Capital) and PEXA are excluded; Charter Hall Group and Ingenia are included because each is stapled to a trust and sits in the A-REIT index. Together the twenty are worth about $143 billion, and Goodman alone is $53 billion of it.
| ASX | Trust | What it owns | Market cap | Price 2 Oct | 1-year |
|---|---|---|---|---|---|
| GMG | Goodman Group | Logistics & data centres (global) | $53.2bn | $25.91 | -23.1% |
| SCG | Scentre Group | 42 Westfield centres (AU/NZ) | $17.5bn | $3.35 | -18.9% |
| VCX | Vicinity Centres | 60 shopping centres incl. Chadstone | $10.6bn | $2.27 | -10.3% |
| SGP | Stockland | Communities, land lease, logistics, retail | $10.0bn | $4.11 | -33.3% |
| CHC | Charter Hall Group | Funds manager ($94bn FUM) + co-investments | $8.7bn | $18.30 | -20.4% |
| GPT | GPT Group | Retail, office, logistics + funds | $8.5bn | $4.44 | -18.1% |
| MGR | Mirvac Group | Office, residential development, BTR | $6.9bn | $1.780 | -22.3% |
| DXS | Dexus | Office-weighted + $36bn funds | $5.9bn | $5.56 | -23.0% |
| BWP | BWP Group | Bunnings-anchored large-format retail | $2.7bn | $3.49 | -5.9% |
| RGN | Region Group | Supermarket-anchored neighbourhood centres | $2.5bn | $2.15 | -10.4% |
| CLW | Charter Hall Long WALE | 505 long-lease assets, 9.2-yr WALE | $2.3bn | $3.18 | -27.7% |
| HDN | HomeCo Daily Needs | Neighbourhood & large-format retail | $2.2bn | $1.045 | -23.7% |
| CQR | Charter Hall Retail | Convenience retail + net-lease fuel | $2.0bn | $3.42 | -17.6% |
| INA | Ingenia Communities | Land lease, holiday parks, seniors rental | $1.9bn | $4.78 | -15.3% |
| CIP | Centuria Industrial | 83 urban-infill industrial assets | $1.7bn | $2.73 | -21.8% |
| GOZ | Growthpoint Properties | Suburban office 56%, industrial 34% | $1.4bn | $1.910 | -26.5% |
| SKG | Storage King Group | Self-storage (ex Abacus Storage King) | $1.4bn | $1.075 | -23.2% |
| DGT | Digico Infrastructure | Data centres, SYD1 build-out | $1.4bn | $2.47 | -9.5% |
| WPR | Waypoint REIT | 394 service stations, 94% Viva Energy | $1.4bn | $2.10 | -22.2% |
| ARF | Arena REIT | Childcare 91%, healthcare 9% | $830m | $2.02 | -48.3% |
Two things leap out. First, the falls are broad: eighteen of the twenty are down double digits over twelve months, and the two exceptions — BWP and Digico — are down 6% and just under 10%. Second, the falls are not evenly deserved. Stockland is down a third despite earnings growing 10% and guidance for more. Arena REIT is down nearly half because a childcare tenant that paid 14% of its rent went into administration in August. Charter Hall Group fell 20% while upgrading its guidance three times. The market has been selling the sector, not the trusts — which is exactly the condition under which individual trusts get mispriced.
Yield, P/E and price-to-NTA, side by side
Three measures do most of the work in valuing a REIT, and each needs a caveat before the table makes sense.
Distribution yield is the cash you receive divided by the price. The table uses each trust's guided distribution for the current year where guidance exists (FY27 for June-year reporters, calendar 2026 for Scentre, GPT and Waypoint), otherwise the last paid. It is the number most retail investors buy on, and the one most likely to mislead on its own: Storage King yields 5.8% on last year's payout and 4.2% on this year's, because it cut.
Price-to-earnings for a REIT should never use the statutory profit you will see on a broker app. Statutory profit includes unrealised revaluations, so Vicinity "earned" $1.39 billion last year and Dexus "earned" $482 million, neither of which is cash. The table divides price by funds from operations (FFO) or operating earnings per security — the sector's own measure of recurring cash profit — using the current-year guidance. On that basis the sector sits on about 13 times, well below the broader market.
Price-to-NTA compares the share price with the independently valued net assets per security at 30 June 2026. Below 1.0x you are buying buildings for less than the valuer says they are worth — or the market thinks the valuer is behind. Above 1.0x you are paying for something beyond the bricks: Goodman's development pipeline, Charter Hall's $94 billion funds-management business, Ingenia's land-lease development margin.
| ASX | Distribution* | Yield | P/E (FFO) | NTA | Price/NTA | Gearing |
|---|---|---|---|---|---|---|
| GMG | 30.0c | 1.2% | 18.3x | $11.79 | 2.20x | 19.5% |
| SCG | 18.5c | 5.5% | 14.1x | $3.71 | 0.90x | 35.5% |
| VCX | 13.7c | 6.0% | 14.1x | $2.59 | 0.88x | 26.1% |
| SGP | 25.2c | 6.1% | 10.7x | $4.39 | 0.94x | 22.7% |
| CHC | 53.7c | 2.9% | 16.1x | $5.95 | 3.08x | 14.2% |
| GPT | 24.5c | 5.5% | 12.5x | $5.61 | 0.79x | 31.5% |
| MGR | 9.90c | 5.6% | 13.4x | $2.33 | 0.76x | 24.1% |
| DXS | 37.0c | 6.7% | 14.4x | $8.92 | 0.62x | 33.4% |
| BWP | 20.0c | 5.7% | 18.2x | $4.11 | 0.85x | 18.5% |
| RGN | 14.5c | 6.7% | 13.0x | $2.57 | 0.84x | 34.1% |
| CLW | 25.5c | 8.0% | 12.5x | $4.71 | 0.68x | 27.5% |
| HDN | 8.60c | 8.2% | 11.9x | $1.56 | 0.67x | 35.7% |
| CQR | 26.4c | 7.7% | 12.5x | $5.03 | 0.68x | 30.9% |
| INA | 9.60c | 2.0% | 12.7x | $4.28 | 1.12x | 31.0% |
| CIP | 17.3c | 6.3% | 14.4x | $4.01 | 0.68x | 34.9% |
| GOZ | 18.4c | 9.6% | 8.3x | $3.05 | 0.63x | 41.6% |
| SKG | 4.50c | 4.2% | 17.2x | $1.77 | 0.61x | 33.7% |
| DGT | 15.0c | 6.1% | 15.1x | $3.50 | 0.71x | 39.0% |
| WPR | 17.1c | 8.2% | 12.3x | $2.92 | 0.72x | 32.4% |
| ARF | 18.0c | 8.9% | 10.3x | $3.60 | 0.56x | 24.5% |
*Current-year guided distribution per security (FY27 for June-year reporters; calendar 2026 for SCG, GPT and WPR; ARF at the "not less than 18c" floor). P/E uses guided FFO or operating EPS. NTA at 30 June 2026. Gearing as reported (look-through where the trust reports it that way).
Sixteen of the twenty now pay more than a government bond, and eight pay 6.5% or better. That is the income case in one picture. The second picture is the asset case.
A median discount of 26% is wide by historical standards — BDO's survey of the sector put the median discount at 12% a year earlier — but two cautions apply. The June valuations were struck when the ten-year bond was already above 5%, so they are not obviously stale, which argues the discounts are real. Against that, the trusts with the deepest discounts are the ones the market trusts least: Dexus at 0.62x after a 12–17% earnings cut and a court fight over its airport stake; Arena at 0.56x with a third of its childcare rent being re-let; Growthpoint at 0.63x carrying 41.6% gearing into suburban office. The cheapest number on the page is rarely the cheapest trust.
Centuria Industrial sold $200 million of warehouses in FY26 at an average 17% above book value and still trades at 0.68x. Scentre sold half of Westfield Mt Gravatt to Australian Retirement Trust at a 5.5% capitalisation rate, in line with its book, and trades at 0.90x. Vicinity sold $327 million of non-core centres 18% above book. When private buyers keep paying book or better for the same assets the listed market is marking down, the discount is a market opinion, not a valuation fact — and it is the kind that has closed before, in 2019 and again in 2023–24.
How many years of distributions repay the price
Yield tells you this year's income. Payback asks a more patient question: if you bought today and simply banked every distribution, how many years until the cash received equals the price paid? It ignores capital growth and capital loss, which is the point — it measures how much of your return is contractual rent rather than hope.
The table shows two versions. The first holds each trust's current distribution flat forever, which is harsh for the growers and kind to the cutters. The second grows the distribution by 3% a year, roughly the sector's long-run record and in line with the FY27 guidance of Region, Centuria Industrial, Charter Hall Retail and BWP. The arithmetic for the growing case is the standard annuity formula; the answer is in years.
| ASX | Distribution | Yield | Payback, flat | Payback, +3% p.a. | What the number is telling you |
|---|---|---|---|---|---|
| GOZ | 18.4c | 9.6% | 10.4 yrs | 9.2 yrs | 9.6% yield prices in 41.6% gearing and office risk |
| ARF | 18.0c | 8.9% | 11.2 yrs | 9.8 yrs | Distribution cut to a floor; Edge centres being re-let |
| HDN | 8.60c | 8.2% | 12.2 yrs | 10.5 yrs | FY27 FFO −2% on debt costs; flat payout |
| WPR | 17.1c | 8.2% | 12.3 yrs | 10.6 yrs | 3% growth, 94% of rent from Viva Energy |
| CLW | 25.5c | 8.0% | 12.5 yrs | 10.8 yrs | Flat FY27; 85% hedged, 9.2-yr leases |
| CQR | 26.4c | 7.7% | 13.0 yrs | 11.1 yrs | +3.5% growth and record 99.1% occupancy |
| RGN | 14.5c | 6.7% | 14.8 yrs | 12.4 yrs | +3% guidance, 100% hedged |
| DXS | 37.0c | 6.7% | 15.0 yrs | 12.6 yrs | FY27 earnings cut 12–17%; distribution held |
| CIP | 17.3c | 6.3% | 15.8 yrs | 13.1 yrs | +3% distribution; assets sold 17% above book |
| SGP | 25.2c | 6.1% | 16.3 yrs | 13.5 yrs | Flat payout at 69% of FFO; FFO +3–6% |
| DGT | 15.0c | 6.1% | 16.5 yrs | 13.6 yrs | +25% distribution as SYD1 fills |
| VCX | 13.7c | 6.0% | 16.6 yrs | 13.7 yrs | Payout 95–100% of AFFO; growing |
| BWP | 20.0c | 5.7% | 17.4 yrs | 14.2 yrs | +3% but payout above FFO |
| MGR | 9.90c | 5.6% | 18.0 yrs | 14.6 yrs | +4% distribution; buyback running |
| SCG | 18.5c | 5.5% | 18.1 yrs | 14.7 yrs | +4.25% guidance upgraded in August |
| GPT | 24.5c | 5.5% | 18.1 yrs | 14.7 yrs | CY26 24.5c; +2% on 2025 |
| SKG | 4.50c | 4.2% | 23.9 yrs | 18.3 yrs | Cut 27% to 4.5c for FY27 |
| CHC | 53.7c | 2.9% | 34.1 yrs | 23.8 yrs | Funds manager; payout a fraction of earnings |
| INA | 9.60c | 2.0% | 49.8 yrs | 30.9 yrs | Growth developer; $5.25 takeover bid on the table |
| GMG | 30.0c | 1.2% | 86.4 yrs | 43.3 yrs | Flat 30c; priced for 9% earnings growth |
Read the bottom of the table first. Goodman at 86 years and Ingenia at 50 are not income investments at any price; they are growth businesses that happen to be structured as trusts, and anyone buying them for yield has misread the label. Charter Hall Group at 34 years is a funds manager whose distribution is a fraction of its earnings by design. The middle of the table — Scentre, GPT, Mirvac, BWP, Vicinity, Stockland at 16 to 18 years — is where a conventional long-term property income sits, and those paybacks shorten to 14 or 15 years if distributions grow at 3%.
The top of the table needs the most care. Growthpoint repays in 10 years because it yields 9.6%, and it yields 9.6% because its gearing is 41.6% and more than half its buildings are suburban offices. Arena repays in 11 years on a distribution that has just been cut and could be cut again if the Edge Early Learning centres re-let at lower rents. HomeCo Daily Needs, Waypoint and Charter Hall Long WALE repay in about 12 years on distributions that are flat or slightly falling. A short payback is the market telling you it doubts the distribution. Sometimes the market is wrong — Charter Hall Retail at 13 years is growing its payout 3.5% and has 99% occupancy — and those are the ones worth the work.
What the experts say each one is worth
The table collects the sell-side consensus (the count and average 12-month target of the brokers covering each trust, from FNArena, MarketScreener, TipRanks and StockAnalysis, all as at late September or early October 2026), Morningstar's published fair value where one could be verified in 2026, and the one-line reason each trust is where it is. Where a Morningstar figure is marked "n/f" it could not be found in a current report and we have not guessed.
| ASX | Broker consensus | Avg target | Upside | Morningstar FV | The debate in one line |
|---|---|---|---|---|---|
| GMG | Buy (14 analysts) | $34.47 | +33% | $29.00 | Data-centre pipeline vs 2.2x NTA and a 1.2% yield |
| SCG | Buy (12) | $4.03 | +20% | $4.00 | Best occupancy in the sector vs 35.5% gearing |
| VCX | Hold (12) | $2.61 | +15% | n/f | Premium-centre strategy working vs heavy capex; one Sell |
| SGP | Buy (10) | $5.18 | +26% | n/f | Earnings growing vs housing exposed to four rate rises |
| CHC | Buy (11) | $23.91 | +31% | n/f | Record inflows vs cyclical fee income at 3x NTA |
| GPT | Buy/Outperform (12) | $5.45 | +23% | n/f | Deep discount vs office at 92% occupancy |
| MGR | Buy (11) | $2.11 | +19% | n/f | Buyback and 24% discount vs residential settlement risk |
| DXS | Hold/Outperform (11) | $6.50 | +17% | n/f | Cheapest large cap vs earnings cut and airport litigation |
| BWP | Hold (9) | $3.82 | +9% | n/f | Most defensive balance sheet vs flat earnings; no Buys |
| RGN | Buy/Hold (7) | $2.51 | +17% | n/f | Steady 3% growth vs nothing more than that |
| CLW | Hold (2/2/2) | $3.71 | +17% | $4.60 | Long leases and 8% yield vs flat earnings; two Sells |
| HDN | Moderate Buy (4/5/0) | $1.31 | +25% | n/f | 8% yield vs highest gearing and falling FFO |
| CQR | Outperform (11) | $4.43 | +30% | $4.80 | Growing payout at a 52-week low; 29% to target |
| INA | Strong Buy (4/0/0) | $5.27 | +10% | n/f | Board rejected $5.25; brokers above the bid |
| CIP | Outperform (5/5/0) | $3.37 | +23% | n/f | Sales 17% above book vs 34.9% gearing |
| GOZ | Buy (3 brokers) | $2.43 | +27% | n/f | Deepest office discount vs 41.6% gearing; 3 brokers |
| SKG | Buy/Hold (1/2/0) | $1.25 | +16% | n/f | Only listed self-storage left vs distribution cut |
| DGT | Buy (5/0/0) | $3.31 | +34% | $3.00 | All five brokers Buy; Morningstar fairly valued |
| WPR | Split (1 Buy/1 UW) | $2.54 | +21% | $2.70 | 7.9% yield vs single tenant and EV risk; split views |
| ARF | Buy (3/1/1) | $2.73 | +35% | $3.50 | Oversold on tenant default vs further rent risk |
Consensus and targets from FNArena, MarketScreener, TipRanks and StockAnalysis, 22 September–2 October 2026; counts are analysts covering, and buy/hold/sell splits where published. Morningstar fair values are the latest found in 2026 reports; n/f = no current figure found. Upside is the average target against the 2 October close.
The pattern is unusual. In a normal sell-off the brokers downgrade with the price; this year the targets have mostly held while prices fell, which is why the average upside across the twenty is 22% and only Vicinity, BWP and Charter Hall Long WALE carry a Hold consensus. Ord Minnett's 9 September note cutting targets across the sector for expected cap-rate expansion was the exception, and even its targets sit above today's prices. The broker view, in short, is that this is a rate scare rather than an earnings problem — and the FY26 results, where most of the twenty met or beat guidance, support them.
Morningstar's analysts, who value on a longer horizon and are less swayed by the bond curve, see things in two tiers. Scentre ($4.00 fair value, four stars, one of only three A-REITs they give a moat), Charter Hall Retail ($4.80), Charter Hall Long WALE ($4.60) and Arena ($3.50, "the selloff in shares is overdone") all screen as clearly undervalued. Goodman ($29) and Digico ($3.00) they call fairly valued, and Waypoint ($2.70) only modestly cheap after they trimmed it for petrol-site capex. Nobody with a published view calls any of the twenty expensive at these prices, which is itself a warning: unanimity is usually priced in, and here it plainly is not.
Undervaluation across the sector is driven by rate anxiety rather than fundamentals.
Morningstar Australia, 21 May 2026Is now a good time to buy?
Nobody can tell you where the A-REIT index will be at Christmas, and anyone who says otherwise is selling something. What can be done is to set out the three tests that have historically marked the bottom of a listed-property cycle, and report honestly how many are met.
Test one: does the yield beat the bond? At the index level, no — the capitalisation-weighted index yields 3.7% because Goodman is a third of it, and the bond pays 5.33%. For the trusts in this article the answer is mostly yes: sixteen of twenty pay more than the bond and the median is 6.1%. If you buy the index through an ETF you are not getting the yield; if you buy the trusts, or an equal-weighted fund, you are. That distinction matters more in 2026 than in any year since Goodman became the index.
Test two: is the discount to assets wide and tested? Yes. A median 26% discount is wider than at any point since the 2022 drawdown, and private buyers have been paying book value or better for industrial, retail and shopping-centre assets through the year. In 2023 Yarra Capital called a 25–30% discount the point where "the risk-return has finally swung positive"; the sector returned 20% in the following financial year. The same discount is here again.
Test three: has the rate cycle turned? Not yet, and this is the test that matters most. UBS's work on past cycles shows A-REITs start outperforming zero to four months before the first RBA cut, not after. The big four banks do not expect a cut before August 2027; ANZ and Westpac still expect one more rise in November. The Governor's remark on 29 September that four rises may be enough, and the soft August inflation print the next day, produced a 3.1% sector rally in a single session — which shows how much is coiled up waiting for the turn, and how early it still is.
If you are buying for income over a decade: two of three tests are met, the third is closer than it was, and a 6–8% yield with a 20–30% asset discount has rarely been a bad decade-long entry in this sector. Buying in instalments through the November decision and the February results is the obvious way to handle not knowing the bottom.
If you are trading for a rebound: wait for the third test. A November rise would push bond yields higher and the sector lower, and nothing in the valuation stops that. The signal to watch is the ten-year bond, not the cash rate.
If you are choosing between trusts: the sell-off has been indiscriminate, so pay for quality rather than yield. Occupancy above 98%, gearing below 30%, guidance for growth and asset sales above book are the four marks that separate Charter Hall Retail, Region, Scentre, Stockland and Centuria Industrial from the trusts that are cheap for a reason.
How interest rates move REIT prices
Four channels connect a rate decision in Martin Place to the price of a property trust, and they do not all point the same way or move at the same speed.
The valuation channel. A building's value is its net rent divided by its capitalisation rate, and cap rates track bond yields with a lag of six to eighteen months. Scentre's centres are on a 5.45% cap rate, Dexus's offices 6.22%, Goodman's warehouses lower still. If cap rates expand 50 basis points from 5.5% the asset falls 8.3% in value; with 30% gearing the equity falls about 12%. This is the slow channel — it shows up in December and June valuations — and it is the one Ord Minnett was pricing when it cut targets in September.
The earnings channel. Every trust carries debt, and the unhedged part reprices immediately. Across the twenty, gearing runs from 14% (Charter Hall Group) to 42% (Growthpoint), and hedging from 66% (Mirvac) to 100% (Region). The Bank's 100 basis points of rises this year cost a trust with 35% gearing and 70% hedging roughly 2–3% of its earnings in year one and more as hedges roll off. That is why HomeCo guided to a 2% earnings fall and BWP to a flat year despite rents rising 3%.
The substitution channel. Income investors compare a REIT's yield with a term deposit or a bond. When the bond offers 5.33% without any landlord risk, a trust yielding 5.5% is no longer compelling, and money leaves. This channel is fast, indiscriminate and reverses just as fast — it is what drove the 22% return in 2019 and the 17% return in 2023 when yields fell.
The multiple channel. Trusts priced on growth rather than assets — Goodman at 18 times earnings and 2.2 times NTA — behave like long-duration growth stocks. Morgan Stanley puts the correlation between Charter Hall Group's P/E and the ten-year bond yield at −0.77. Higher yields compress the multiple regardless of what the earnings do, which is how Goodman lost 23% while growing earnings 10%.
| ASX | Gearing | Debt hedged | Lease profile | Rate sensitivity — our read |
|---|---|---|---|---|
| GMG | 19.5% look-through | n/f | 4.8 yrs | High — priced on growth at 18x; multiple moves with the bond |
| SCG | 35.5% | n/f | Specialty leases short | Moderate — short leases reprice rent; gearing is the drag |
| VCX | 26.1% | n/f | Short | Moderate — modest gearing, turnover rent |
| SGP | 22.7% | n/f | Mixed | High — housing settlements swing with mortgage rates |
| CHC | 14.2% | n/f | 7.3 yrs managed | High — P/E correlation with the bond −0.77 (Morgan Stanley) |
| GPT | 31.5% | n/f | Mixed | Moderate — office cap rates still widening |
| MGR | 24.1% | 66% | Mixed | High — least hedged, plus residential exposure |
| DXS | 33.4% | 91% at 3.0% | Office 4–5 yrs | Price high, income low — hedged through FY27 |
| BWP | 18.5% | n/f | 7.3 yrs | Low — lowest gearing, A3 rated, Bunnings covenant |
| RGN | 34.1% | 100% at 2.9% | Supermarket anchors | Price moderate, income low — fully hedged |
| CLW | 27.5% | 85% | 9.2 yrs | Price high (bond-like leases), income low |
| HDN | 35.7% | n/f | 40% expire after FY32 | High — gearing at target midpoint, FFO already falling |
| CQR | 30.9% | 67% FY27 | 7.1 yrs | Moderate — hedging rolls to 46% in FY28 |
| INA | 31.0% | n/f | Land-lease, perpetual | Moderate — bid support; home sales rate-sensitive |
| CIP | 34.9% | n/f | 7.0 yrs | Moderate — 30% leasing spreads offset finance costs |
| GOZ | 41.6% | n/f | 6.1 yrs | Very high — highest gearing in the set |
| SKG | 33.7% | n/f | Month-to-month | Moderate — storage rents reset quickly; cut already made |
| DGT | 39% (18% pro forma) | n/f | Long-term IT contracts | High until CHI1 sale settles; then low |
| WPR | 32.4% | 95% | 5.9 yrs | Price high (net-lease), income low |
| ARF | 24.5% | n/f | 17.5 yrs | Price very high (longest leases); tenant risk dominates |
Gearing and hedging as disclosed at FY26 or 1H26 results; n/f = hedge ratio not found in the results materials reached. "Price" sensitivity is how the security is likely to move with bond yields; "income" is how next year's distribution is likely to move. The reads are the author's judgement from the disclosed figures.
Two points of history to hold onto. In 2022, when the ten-year yield more than doubled to 3.4%, the A-REIT index returned −17% for the year while the ASX 200 was flat; many trusts fell below NTA and the sector then returned 17% in 2023 and 20% in the 2024 financial year as the cycle turned. The 30-year record, through all of it, is 7.8% a year — behind Australian shares at 9.0%, ahead of bonds at 5.2%. Rate cycles move the sector 20% either way; they have not, over any ten-year window, changed what it earns.
A fifth rise on 3 November is priced at roughly 20% by the market but expected by two of the four major banks. If it comes, expect the ten-year bond to test 5.5% and the sector to retest its lows, with the longest-duration names — Goodman, Charter Hall Group, the long-WALE trusts — falling furthest. If the Bank holds and signals that it is done, the 30 September rally is the template: the most geared and most discounted trusts bounce hardest. Either way, the trusts with 85% or more of debt hedged (Dexus, Region, Waypoint, Charter Hall Long WALE) will see almost no change in next year's distribution; the movement is all in the price.
Listed REITs or a property of your own?
The honest comparison is not "REITs versus property", because a REIT is property. It is a choice between owning a small slice of 42 Westfields with a professional manager and daily liquidity, or owning all of one house in one suburb with your own name on the title and the bank's name on the mortgage. Each has a cost the other does not. The table sets them against each other on the measures that decide the outcome for most investors.
| Listed REITs (the 20) | Direct residential property | |
|---|---|---|
| Income yield, today | 6.1% median (range 1.2–9.6%) | 3.0% Sydney house gross; ~2% net. 3.9% national gross |
| Minimum outlay | $500 marketable parcel | $900,000 median dwelling; ~$180,000 deposit plus costs |
| Cost to buy | ~0.1% brokerage | Stamp duty 3–5% plus conveyancing; ~$38,000 on $900,000 in NSW |
| Cost to sell | ~0.1% brokerage | Agent 1.6–3% plus marketing; ~$20,000–25,000 on $900,000 |
| Time to sell | Same day, T+2 settlement | 39 days median on market plus 4–6 weeks to settle (Cotality, Sep 2026) |
| Diversification | Hundreds of buildings, several sectors, per trust | One building, one suburb, one tenant |
| Leverage available | Margin loans only, typically 50–70% LVR at higher rates | 80–90% LVR home-loan rates; the main source of property returns |
| Ongoing costs | Nil beyond the trust's management fee, built into the yield | Management 7–8% of rent, rates, insurance, maintenance, land tax, strata |
| Control | None — you own units, the manager runs the assets | Full — tenant, renovation, timing, sale price |
| Price visibility | Daily; fell 20%+ in 2026 on screen | Twice-yearly valuation at best; Sydney −7% y/y to Sep 2026 |
| Discount to asset value | Median 26% below NTA at 2 Oct 2026 | None — you pay the market price |
| Negative gearing after 1 Jul 2027 | Not relevant (no interest deduction) | Quarantined for established homes bought after 12 May 2026; new builds exempt |
| CGT from 1 Jul 2027 | Indexation plus 30% minimum tax on post-2027 gains | Identical |
| Tax on income | Marginal rate; part tax-deferred; some franking on stapled securities | Marginal rate; depreciation and interest deductible against rent |
Work the direct side through. A $900,000 house in Sydney yields 3.0% gross, or $27,000 a year. Take off a 7% management fee, council and water rates, landlord insurance, a maintenance allowance of 1% of value and two weeks' vacancy and the net is closer to $18,000, a 2.0% net yield. Add roughly $35,000 of NSW stamp duty and roughly $3,000 of conveyancing on the way in, then 2% agent commission and marketing on the way out, and the round trip costs about $60,000 — more than three years of net rent before the asset has returned anything. The same $900,000 in a basket of the twenty REITs at the median yield pays about $55,000 a year, costs about $20 in brokerage each way, and can be sold on a Tuesday afternoon.
So why does anyone buy the house? Three good reasons. Leverage: a bank will lend 80% against a house at 6% and almost nothing against a REIT, so $180,000 of equity controls $900,000 of property, and if that property grows 5% a year the return on equity is 25% before interest — the mechanism behind most Australian property fortunes, and the mechanism that destroys people when values fall. Control: you choose the asset, the tenant, the renovation and the timing, and the value does not flash red on a screen every day. Tax: until now, negative gearing turned an income loss into a tax refund. From 1 July 2027 that is quarantined for established homes bought after 12 May 2026, which removes most of the tax argument for a new purchase; new builds and anything bought before Budget night keep it.
And the REIT's advantages beyond yield and liquidity: diversification across hundreds of buildings and several property types for $500; no land tax, no strata levies, no 2am phone calls; income that is partly tax-deferred (depreciation passes through the trust as a reduction in your cost base rather than taxable income); and, in a sell-off like this one, the ability to buy assets at a quarter below their valuation, which no vendor of a house will offer you.
The replacement of the 50% CGT discount with cost-base indexation and a 30% minimum tax from 1 July 2027 applies to every CGT asset — REIT units and investment properties alike — and only to gains accrued after that date. It is neutral between the two. The negative gearing quarantine is not: it applies only to established residential property, and only to purchases after 7:30pm on 12 May 2026. For a new investor it is now the single biggest difference between the two routes.
The long-run returns, for what they are worth, do not settle the argument either way: A-REITs returned 7.8% a year over the 30 years to June 2026, and in the 2025 financial year the ASX 200 real-estate sector returned 14.0% against 7.1% for national dwellings. Direct property's extra return has come from leverage, not from the asset. Unlevered, the two have delivered much the same thing — which is what you would expect, since they are the same thing.
The Richer verdict
Listed property is cheap on every measure except the one that moves it next: the direction of bond yields. The twenty trusts here pay a median 6.1%, trade at a median 26% below assets, and their brokers see 22% upside on average. Most of them met or beat guidance in August. That is a sector marked down for what it owns, not for what it earns.
For an income investor with a ten-year horizon, the case for starting now, in instalments, is strong — and it is strongest in the trusts whose discounts are not explained by their own problems: Charter Hall Retail, Region, Scentre, Stockland, Centuria Industrial and GPT. For the highest yields on the page — Growthpoint, Arena, HomeCo — the distribution is doing the talking and the balance sheet or the tenant is the risk; size those positions accordingly. Goodman, Ingenia and Charter Hall Group are different investments entirely and should be judged as growth businesses.
Against a property of your own, the REIT wins on income, costs, diversification and liquidity by a wide margin, and loses on leverage and control. Since the May Budget it no longer loses on tax for a new purchase. If the reason you wanted the house was the rent, the listed market is now paying twice as much for it. If the reason was the leverage, nothing here changes that — but be clear which one you are buying. Knowing the difference is what makes you Richer.
Frequently asked questions
What is an A-REIT and how does it pay me?
An A-REIT is an Australian real estate investment trust listed on the ASX. It owns income-producing property — shopping centres, warehouses, offices, childcare centres, service stations — and must pass its rental income through to unitholders, who are taxed on it personally. Distributions are paid quarterly or half-yearly. Most A-REITs are "stapled", meaning a trust unit and a company share trade together as one security; the company side does development or funds management and can pay franked dividends, the trust side pays unfranked distributions.
Why do REITs fall when interest rates rise?
Four reasons. Higher bond yields raise the capitalisation rate at which buildings are valued, so the buildings are worth less. Higher rates raise interest costs on the unhedged part of the trust's debt, lowering earnings. A higher bond yield competes directly with the REIT's distribution for income investors' money. And trusts priced on growth see their earnings multiples compress. The first and fourth affect the price immediately; the second affects distributions over two or three years as hedges roll off.
Which ASX REIT has the highest yield in 2026?
Of the twenty largest, Growthpoint Properties yields 9.6% on its guided 18.4 cent distribution at the 2 October 2026 price of $1.91, followed by Arena REIT at 8.9% on its reduced "not less than 18 cents" guidance. Both yields are high because the market doubts them — Growthpoint for its 41.6% gearing and office exposure, Arena for the Edge Early Learning default. Among trusts with growing distributions, HomeCo Daily Needs (8.2%), Waypoint (8.2%), Charter Hall Long WALE (8.0%) and Charter Hall Retail (7.7%) are the highest.
Is it better to buy a REIT ETF or the individual trusts?
It depends on what you want. The main A-REIT index is more than a third Goodman Group, which yields 1.2%, so an index ETF such as SLF or VAP yields only 3.3–3.7% and behaves like a data-centre growth stock with some shopping centres attached. An equal-weighted fund (VanEck's MVA) or a hand-picked basket of six to ten trusts captures the 6%-plus yields in this article. The individual route costs more time and brokerage and concentrates risk; the ETF route gives up most of the income case.
How is the payback period calculated?
Payback is the number of years for cumulative distributions to equal today's price. With distributions held flat it is simply price divided by annual distribution — a 6.1% yield repays in 16.4 years. With distributions growing at a constant rate g, the number of years n solves the annuity sum, n = ln(1 + P × g ÷ D) ÷ ln(1 + g), where P is the price and D is this year's distribution. At 3% growth a 6.1% yield repays in about 13.5 years. Neither version counts capital gains or losses, which is deliberate.
What does price-to-NTA actually tell me?
Net tangible assets per security is the independently valued worth of the trust's buildings less its debt, divided by the number of securities. A price below NTA means the market values the trust at less than its valuers do. It can be right (the valuations are stale, or the trust has problems the valuer cannot see) or wrong (the market is pricing a rate scare). The test is whether the trust can sell buildings at or above book — in 2026 Centuria Industrial, Vicinity and Scentre have all done so, which supports their NTAs.
How are A-REIT distributions taxed?
Distributions are usually split on your annual AMMA statement into taxable income (taxed at your marginal rate, no franking), capital gains, and a "tax-deferred" component arising from depreciation that is not taxed when received but reduces your cost base, so more tax falls due when you sell. Stapled securities add a franked dividend from the company side. From 1 July 2027 any capital gain on sale is subject to the new indexation-plus-30%-minimum-tax rules rather than the 50% discount, the same as every other CGT asset.
Would I be better off buying an investment property directly?
On income, no: a Sydney house nets about 2% after costs against a 6% A-REIT median, and buying and selling a house costs 7–10% of its value against a fraction of a percent for shares. Direct property wins when you want 80% bank leverage, control of the asset, or the negative gearing deduction — which from 1 July 2027 only survives for established homes bought before 12 May 2026 and for new builds. Many investors sensibly hold both: the house for leveraged growth, the REITs for income and liquidity.
Sources
Prices are ASX closes on 2 October 2026 from Market Index. Earnings, distributions, NTA, gearing and occupancy are from each trust's FY26 or half-year results announcement (August 2026). Broker targets are averages as published by FNArena, MarketScreener, TipRanks and StockAnalysis between 22 September and 2 October 2026 and will have moved since. Richer Online has no commercial relationship with any trust, broker or data provider named.
- Market Index — ASX listed companies by market capitalisation, closes at 2 October 2026; S&P/ASX 200 A-REIT index, 1,480 on 2 October 2026, −18.59% YTD.
- S&P Dow Jones Indices — Australia & New Zealand dashboard, 30 September 2026: XPJ −13.12% YTD, ASX 200 +3.74%.
- RBA cash rate decisions 2026 — 3 February, 17 March, 5 May, 29 September rises; Westpac and CommBank newsroom summaries; Canstar big-four forecasts, 1 October 2026.
- Trading Economics — Australia 10-year bond yield, 5.33% on 2 October 2026.
- Goodman Group FY26 results, 19 August 2026; Morningstar fair value $29 (20 February 2026).
- Scentre Group 1H26 results and guidance upgrade, 25 August 2026; Morningstar fair value $4.00 (April 2026).
- Vicinity Centres Appendix 4E FY26, 20 August 2026.
- Stockland FY26 results presentation, 19 August 2026.
- Charter Hall Group FY26 results, 21 August 2026.
- GPT Group 2026 interim result, 17 August 2026.
- Mirvac FY26 result, 19 August 2026.
- Dexus FY26 results release, 20 August 2026; Business News Australia on FY27 guidance.
- BWP Group FY26 results, 19 August 2026.
- Region Group FY26 results announcement, 18 August 2026.
- Charter Hall Long WALE REIT FY26 results, 13 August 2026; Morningstar fair value $4.60, 18 August 2026.
- HomeCo Daily Needs REIT FY26 results call, 13 August 2026.
- Charter Hall Retail REIT FY26 results, 6 August 2026; Morningstar fair value $4.80, 11 August 2026.
- Ingenia Communities Annual Report 2026; Warburg Pincus $5.25 proposal, 28 September 2026.
- Centuria Industrial REIT FY26 results, 11 August 2026.
- Growthpoint Properties Australia FY26 results, 17 August 2026.
- Storage King Group FY26 results, 14 August 2026.
- Digico Infrastructure REIT FY26 results, 21 August 2026; Morningstar fair value $3.00, 7 May 2026.
- Waypoint REIT 1H26 results, 27 August 2026; Morningstar fair value $2.70, 3 June 2026.
- Arena REIT FY26 results call, 21 August 2026; Edge Early Learning administration, 26 August 2026.
- Broker consensus: FNArena stock analysis (1 October 2026), MarketScreener consensus pages (28 August–2 October 2026), TipRanks and StockAnalysis (September 2026).
- Market Index — UBS on the A-REIT sell-off, 26 March 2026; Morningstar — selloff opens the door, 21 May 2026.
- Market Index — Morgan Stanley and UBS on rates and A-REITs, 17 July 2024; VanEck — A-REIT calendar-year returns.
- Vanguard Index Chart 2026 — 30-year returns to 30 June 2026.
- Cotality Home Value Index, October 2026 release (data to 30 September 2026) — gross yields, median values, vacancy.
- Stamp duty on investment property by state, updated 18 July 2026; austax.tools net yield worked example, March 2026.
- ATO — negative gearing and CGT reforms, Treasury Laws Amendment (Tax Reform No. 1) Act 2026.
- BDO A-REIT Survey 2025 — median discount to NTA and sector gearing.
Keep reading
James Zhang writes richer.au's Property, Shares and Wealth coverage. He has bought, held and sold residential, commercial and development property over two decades, and holds listed property alongside it — which is why this comparison is written from both sides of the fence.
General information only. This article is general information, not personal financial, investment, taxation or legal advice, and doesn't account for your objectives, financial situation or needs. The "worth buying" and "cheap for a reason" calls are the author's judgement from published figures, not forecasts for any security. Broker targets and fair values are those firms' opinions at the dates shown and change without notice. Figures are sourced and dated as shown and can change. Richer Online Pty Ltd (ABN 62 159 604 949) does not hold an Australian Financial Services Licence and has no commercial relationship with any trust, broker or data provider named. Consider seeking advice from a licensed financial adviser, accountant or lawyer before acting. See our Terms of Use or get in touch.
Get richer, one decision at a time
New articles as they land.
Property, shares, commodities and tax strategy — worked examples with real Australian figures and no product spruiking. One email when something new goes live.
No spam · unsubscribe any time