4000 · Economy
Not a recession. Not yet.
Growth per person has stalled, inflation is back at 4%, unemployment is at a five-year high and rates are still rising. How close Australia is to recession and stagflation — and what it means for your money.
The economy is still growing. Most households can't feel it.
Australia is not in recession. Real GDP rose 0.4% in the June quarter and 2.1% over the year, the Reserve Bank's own base case is still for growth, and the jobs market added 39,500 positions in August. On the official scoreboard, the economy is slowing, not shrinking.
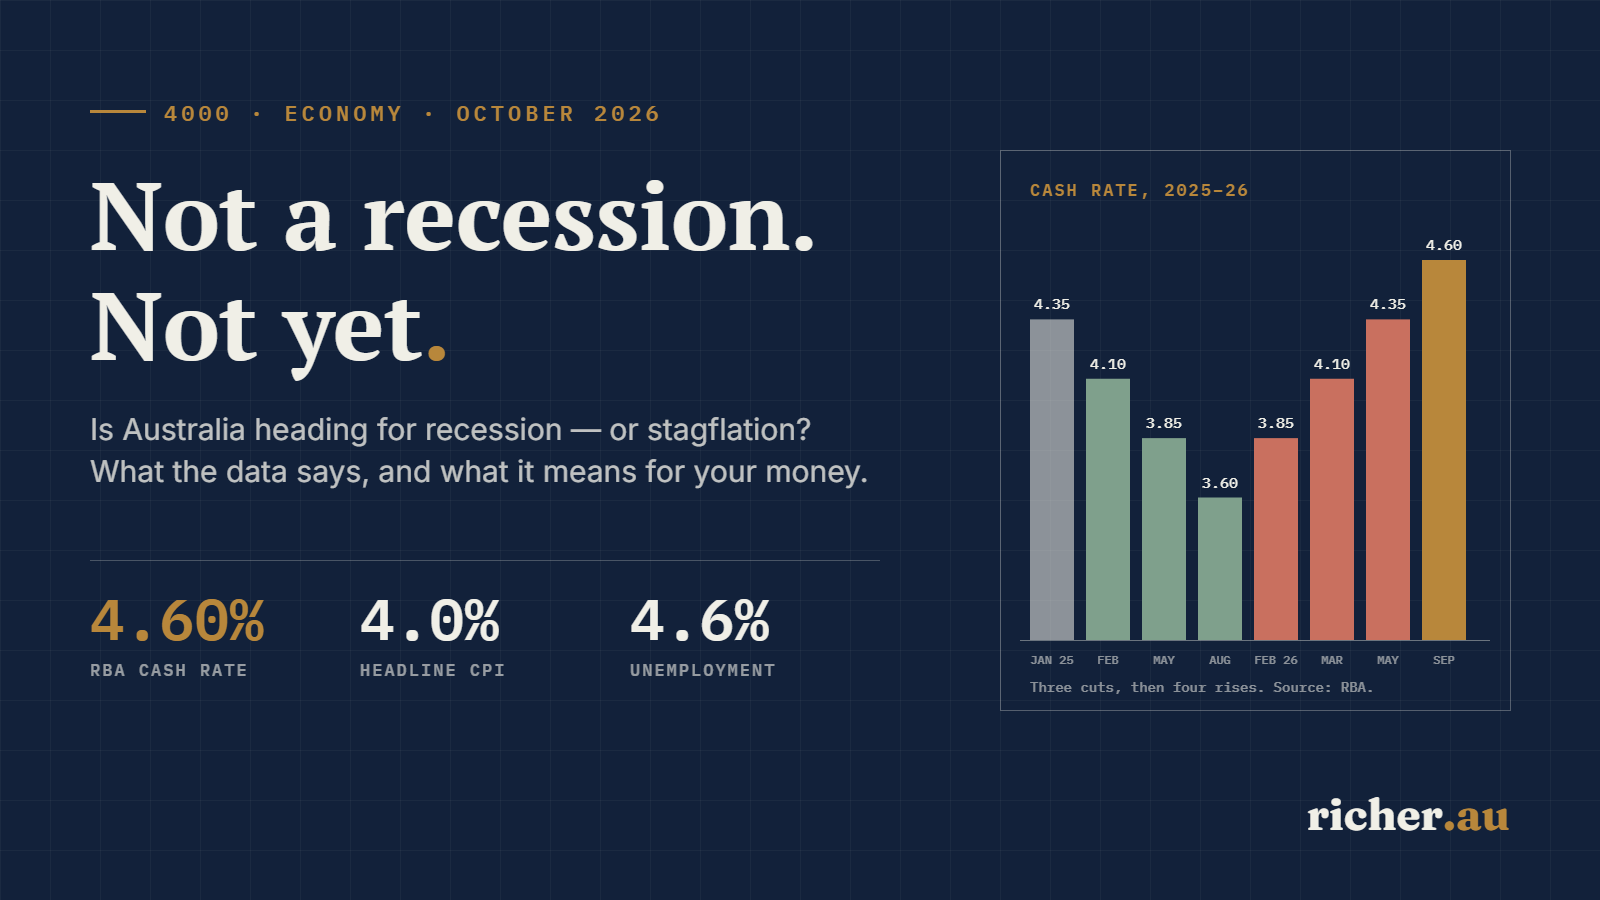
But the official scoreboard is not where people live. Output per person was flat in the June quarter after a small fall in March. Headline inflation jumped to 4.0% in August on a petrol shock from the Strait of Hormuz. Real wages are going backwards. Unemployment has climbed to 4.6%, the highest since late 2021. National home values have fallen for six straight months. And on 29 September the Reserve Bank raised rates for the fourth time this year anyway, to 4.60%, the highest cash rate since 2011.
That combination — slow growth, sticky inflation, rising unemployment and rising rates — is why the words recession and stagflation are suddenly everywhere. This article sets out what each word actually means, how close Australia is to each on the latest data, what the economists and the RBA expect, how each outcome would land on mortgage holders, renters, savers, workers and retirees, and what it all means for how you invest. Every figure is dated and sourced.
- What a recession actually is (three definitions)
- Where the economy stands in October 2026
- The recession test: for and against
- Stagflation: are we there?
- How it lands on Australian households
- Three scenarios for the next 12 months
- What it means for investing
- Five releases to watch before Christmas
- The Richer verdict
- Frequently asked questions
What a recession actually is (three definitions)
Most of the confusion in the recession debate comes from people using the same word for three different things. It is worth separating them before looking at the numbers, because Australia currently passes one test, fails another and sits on the edge of the third.
1. The technical recession
The newspaper definition is two consecutive quarters of falling real GDP. It is crude — it ignores population growth, unemployment and incomes — but it is the one that makes headlines. Australia has had only one since the early 1990s: the COVID collapse of the March and June quarters of 2020. On this test Australia is clearly not in recession today. GDP has risen every quarter for years, including 0.4% in the June quarter of 2026.
2. The per-person (per capita) recession
Australia's population grows quickly, mostly through migration, so total GDP can rise even while output per person falls. When GDP per capita goes backwards for two or more quarters, the average person is producing — and, broadly, earning — less, even though the headline number says growth. GDP per capita was flat in the June quarter of 2026 after a small fall in March. That is not technically a per-capita recession, but it is the edge of one. Deloitte Access Economics put the point bluntly this month: measured per hour worked, the Australian economy is smaller today than it was at the end of 2019.
3. The recession you feel
The third definition is the household one: are real disposable incomes falling, is it harder to find work, are asset prices dropping and is spending being cut? On that test, a large share of Australians are already there. Real wages fell 0.8% over the year to June, unemployment is rising, home values are falling in 97% of capital-city suburbs, and four rate rises add roughly $400 a month to the repayments on a $600,000 loan.
Households will continue to experience recession-like conditions.
Deloitte Access Economics, Business Outlook, 7 October 2026So the honest short answer to "is Australia in recession?" is: not officially, not per person yet, but for many households it already feels like one.
Where the economy stands in October 2026
Growth: still positive, but carried by things rate rises don't touch
GDP rose 0.4% in the June quarter, a touch above market expectations, and 2.1% through the year (ABS, 2 September 2026). The ABS described growth as subdued, with households behaving cautiously and imports soaking up much of the extra spending. Household consumption rose 0.4%. The strong parts were private business investment — up 10.4% on a year earlier, much of it data centres and AI-related equipment — and government spending. Deloitte's point is that the engines of growth (government, data-centre construction, spending by older and wealthier households) are largely immune to higher interest rates, so the RBA's squeeze lands disproportionately on mortgage holders, home building and small business.
Inflation: a supply shock on top of a demand problem
Headline inflation rose to 4.0% in the 12 months to August, up from 3.5% in July (ABS, 30 September 2026). Automotive fuel rose 14.8% in the single month of August. Housing (+5.7%) and transport (+5.6%) were the biggest contributors, with electricity and new dwelling costs both climbing. Underlying inflation — the trimmed mean, which strips out the most extreme price moves and is the measure the RBA watches — held at 3.6% for the third straight month, still well above the 2–3% target band.
The oil shock is real. Flows of crude and products through the Strait of Hormuz averaged an estimated 4.9 million barrels a day in the June quarter of 2026, against 21.6 million in the December quarter of 2025 (US EIA). Brent crude was trading around US$102 a barrel in early October, up more than half on a year earlier. Governor Bullock said at the September press conference that the conflict had made the country poorer and that fuel, fertiliser and transport prices now look permanently higher rather than temporarily so.
Rates: four rises in eight months
The RBA cut three times in 2025, to 3.60%, then reversed course. It raised the cash rate in February, March and May 2026 to 4.35%, held in June and August, then raised again to 4.60% on 29 September in a unanimous decision. The Board's statement said some of the upside risks it had flagged in August were materialising — the broader Middle East conflict, AI-driven price rises for technology goods, and continuing pressure on domestic capacity — and that it would raise again if needed.
Jobs: softer, not collapsing
Unemployment rose to 4.6% in August from 4.5% (ABS, 24 September 2026), the highest since November 2021. But employment still grew by 39,500 and the participation rate rose to 67.1% — more people came looking for work than the economy absorbed. Underemployment edged down to 6.2%. Youth unemployment rose to 10.8%, and Victoria (5.2%) and Tasmania (5.0%) are the weakest states. This is a labour market that is cooling, not one that is shedding jobs at recession pace.
Housing and confidence
Cotality's national home value index fell 1.1% in September, the sixth straight monthly fall, leaving values 5.2% below the March 2026 record (Cotality, 1 October 2026). Sales volumes were tracking about 19% below a year earlier. Regional values are still up 5.6% on the year while the combined capitals are down 1.8%. Rents, meanwhile, are 5.5% higher than a year ago, pushing gross rental yields to 3.85%, the highest since 2019. Consumer sentiment fell to 80.4 in October, a six-month low.
| Indicator | Latest | Period | Direction | Source |
|---|---|---|---|---|
| Real GDP, quarter | +0.4% | Jun qtr 2026 | Slowing | ABS |
| Real GDP, year | +2.1% | Jun qtr 2026 | Slowing | ABS |
| GDP per person, quarter | 0.0% | Jun qtr 2026 | Stalled | ABS |
| Headline CPI, annual | 4.0% | Aug 2026 | Rising | ABS |
| Trimmed-mean CPI, annual | 3.6% | Aug 2026 | Stuck | ABS |
| Unemployment rate | 4.6% | Aug 2026 | Rising | ABS |
| Wage Price Index, annual | 3.2% | Jun qtr 2026 | Easing | ABS |
| RBA cash rate | 4.60% | From 30 Sep 2026 | Rising | RBA |
| Home values from peak | −5.2% | Sep 2026 | Falling | Cotality |
| Consumer sentiment | 80.4 | Oct 2026 | Falling | Westpac–MI |
The recession test: for and against
Put the evidence side by side and the case is genuinely balanced, which is why serious economists land in different places.
| Pointing towards recession | Pointing away from recession |
|---|---|
| Four rate rises in 2026, with the RBA saying it will go again if needed. Most of the effect is still to come — the Governor estimates 12 to 18 months for the full impact. | Business investment is up 10.4% on a year, driven by data centres and AI equipment that higher rates barely touch. |
| Real wages falling 0.8% a year, petrol up sharply, consumer sentiment at 80.4: the conditions for a consumer pull-back. | Employment is still growing — 39,500 jobs added in August, more than a million since unemployment was 3.5%. |
| House prices down 5.2% from peak and transaction volumes down about a fifth — a wealth hit and a drag on home building. | Government spending and population growth keep adding to aggregate demand. |
| Global bond yields rising fast, with the Australian 10-year above 5.2% in September, its highest since 2011 — a risk for stretched share valuations. | Major trading partners have grown faster than expected; AI investment has so far outweighed the oil shock globally (RBA). |
| An unresolved Middle East conflict that could keep oil above US$100 and force rates higher still. | Household balance sheets are strong: under 1% of borrowers are in negative equity and about 2% of variable-rate owner-occupiers face a cash-flow shortfall (RBA Financial Stability Review, October 2026). |
What the forecasters say
| Forecaster | Recession call | Key detail | Date |
|---|---|---|---|
| Reserve Bank of Australia | Not the base case | Governor Bullock: a recession is possible if inflation expectations become unanchored | 29 Sep 2026 |
| Deloitte Access Economics | No near-term recession | Recession-like conditions for households; a 2027 recession possible if the Middle East worsens and bond yields hit share prices; cash rate 4.85% in November | 7 Oct 2026 |
| HSBC (Paul Bloxham) | About 50% risk | Growth close to stalling around year-end; cash rate 4.85% by November | 28 Sep 2026 |
| AMP (Diana Mousina) | About 30% in 12 months | Set before the September rise and the oil re-escalation | Jun 2026 |
| Oxford Economics Australia | Slowdown | Flat per-person household spending in 2026; unemployment near 5% through 2027 | Jun 2026 |
| Westpac | No recession | Expects the economy to keep growing | Sep 2026 |
When the Sydney Morning Herald asked the Governor directly whether the September rise made a recession more likely, her answer was short:
That is not our central base case at this moment.
RBA Governor Michele Bullock, media conference, 29 September 2026Later in the same press conference she was more candid about the tail risk. If people and businesses start to treat inflation in the 3s or 4s as normal, she said, it might take a much sharper slowdown to bring it down — which is the scenario in which the RBA would knowingly push the economy into recession. That is the risk worth watching: not that the RBA blunders into a recession, but that the inflation numbers force its hand.
Stagflation: are we there?
Stagflation is the combination economists once thought impossible: stagnant growth, rising unemployment and high inflation at the same time. It is the worst macro environment for ordinary households because the central bank's two jobs conflict. Cut rates to support jobs and inflation gets worse; raise them to kill inflation and unemployment rises further. Australia's defining experience was the mid-1970s. Underlying inflation reached about 20% by early 1975, headline CPI peaked at 17.7% in the March quarter of 1975, and unemployment rose from 1.4% at the start of the decade to 6.5% by 1978, permanently turning Australia from a low- to a high-unemployment economy (RBA).
On a strict definition, Australia is not in stagflation. Governor Bullock rejected the label directly in September, saying she would not call 3.5% underlying inflation alongside 4.6% unemployment stagflation, because stagflation means very high inflation and very high unemployment. She is right on the numbers: 4.6% unemployment is low by historical standards, and inflation is one percentage point above target, not fifteen.
But look at the direction of every variable and the shape is unmistakable:
- Growth per person: flat to negative for two quarters.
- Inflation: above target for most of the past six years, and rising again on headline.
- Unemployment: up from 3.5% to 4.6%, with Deloitte forecasting 4.9% and Oxford Economics close to 5%.
- Real wages: falling.
- Policy rates: rising into weakness, the textbook stagflation response.
The fairest description is stagflation-lite: the 1970s pattern at roughly a quarter of the 1970s intensity. That matters because it sets up the real question for the next year. Today's mild version can resolve in two very different ways — inflation falls as the economy slows (the RBA's plan), or the oil shock persists, inflation expectations drift up and the RBA has to choose between its two mandates. That fork, not the label, is what should drive how you position your finances.
Both the RBA and Deloitte make the same point: Australia's problem is not that demand is booming, it is that the economy's capacity to supply is growing too slowly. With productivity flat, even modest spending growth pushes up prices, and wages can't rise in real terms. The Governor put it plainly in September — unit labour costs are rising because productivity is doing nothing, not because wages are running away. Until that changes, Australia is structurally prone to this mix of weak growth and sticky inflation.
How it lands on Australian households
Slowdowns don't fall evenly. Deloitte's phrase — muddling through in aggregate while flat or falling per person — means the economy can avoid recession while specific groups take a recession-sized hit. Here is how the current mix lands on each.
Mortgage holders: the front line
Four rate rises add a full percentage point to variable loan rates if passed on in full. The table shows what that means in dollars. Deloitte estimates that five rises in 2026 — if November delivers one more — would add about $9,000 a year to the interest bill on the average new owner-occupier loan.
| Loan size (30 years, P&I) | Monthly at 6.0% | Monthly at 7.0% | Extra per month | Extra per year |
|---|---|---|---|---|
| $600,000 | $3,597 | $3,992 | +$395 | +$4,734 |
| $750,000 | $4,497 | $4,990 | +$493 | +$5,918 |
Illustration only: a 1.00 percentage point rise from an assumed 6.0% variable rate, full pass-through, standard amortisation. Your lender's rate and pass-through will differ.
The aggregate picture is less alarming than the anecdotes. The RBA's October Financial Stability Review estimates about 2% of variable-rate owner-occupier borrowers have a cash-flow shortfall — their income doesn't cover repayments plus essentials — and most of those have savings to bridge it for six months or more. Fewer than 1% of borrowers are in negative equity, and even a further 20% fall in house prices would leave only about 5% underwater. The RBA's severe scenario — unemployment at 6.3%, inflation at 7% and a 5.6% cash rate — would lift the share at risk of default to around 5%, slightly above the 2023 peak. The pressure point is recent buyers with small deposits and high debt-to-income ratios.
Renters
Renters get the worst of both: rents are 5.5% higher than a year ago while real wages are falling. Falling house prices don't help them directly, and higher rates slow the construction of new homes — the Governor herself warned in September that the downturn could make more projects uneconomic for developers, worsening the structural shortage.
Savers and retirees
Higher rates help depositors, but less than it looks. A 5% deposit taxed at a 32% marginal rate (30% plus Medicare levy) nets about 3.4% — below the 4.0% headline inflation rate, so the real after-tax return is still negative. Self-funded retirees on the lower tax brackets and super funds in pension phase do better. For the first time in years, though, cash is at least competitive with the underlying inflation rate before tax.
Workers and job seekers
The adjustment so far is coming through fewer new jobs rather than mass lay-offs: the Governor noted more than a million jobs were created while unemployment rose from 3.5% to 4.6%, because the labour force grew faster. That shows up as longer job searches, fewer hours and fewer pay rises — 79% of jobs had annual pay rises below 4% in the June quarter. Young workers feel it first; youth unemployment is already 10.8%.
Business owners
The RBA expects cash-flow pressure to build for smaller and energy-intensive businesses. Fuel, freight and energy costs have risen sharply, consumers are cutting discretionary spending, and the September CPI release will show how much of those costs firms have managed to pass on. Businesses tied to the AI and data-centre build-out, government contracts or older, asset-rich customers are the relative winners.
Property owners and investors
Values are falling across 97% of capital-city suburbs, led by Sydney (−8.6% from its February peak) and, in September, Brisbane. Investors are cushioned by rising rents and higher yields; owner-occupiers who need to sell in the next year are the most exposed. Regional markets have held up far better than the capitals. For the tax side of property investing in 2026, see our negative gearing explainer.
Three scenarios for the next 12 months
Rather than pretend to a single forecast, it is more useful to weigh three paths and know which signals would tell you which one you are on. The weights below are richer.au's judgement from the published forecasts above, not a prediction.
| Scenario | What happens | Cash rate | Signals that would confirm it |
|---|---|---|---|
| 1. Muddle through (base case) | GDP grows 1–2%, flat per person; underlying inflation drifts towards 3% through 2027; unemployment peaks near 4.9% | One more rise to 4.85%, then on hold; first cut late 2027 | Quarterly trimmed mean near 0.6–0.7%; jobs growth keeps pace with population; oil eases below US$90 |
| 2. Technical recession | Consumers cut harder, housing and non-AI investment fall, two negative GDP quarters in 2027 | Peaks at 4.85–5.10%, then cut quickly | Monthly job losses, unemployment above 5%, retail volumes falling, a negative December-quarter GDP print |
| 3. Stagflation deepens | Hormuz stays constrained, oil stays above US$100, headline CPI 5%+ and expectations rise; growth stalls | Above 5%, as markets were pricing for May 2027 in late September | September-quarter trimmed mean of 1% or more; rising inflation expectations surveys; Brent above US$110 |
What it means for investing
The most important point first: a recession and a stagflation call for different portfolios. In a classic recession, inflation falls, central banks cut, bond prices rise and cash returns shrink. In stagflation, inflation stays high, rates stay up or rise, and shares and bonds can fall together — exactly what happened around the world in 2022. Because Australia is sitting at the fork between the two, the case is for a portfolio that survives both rather than one that bets on either.
What history says works when inflation is high
The most-cited study of investing through inflation is The Best Strategies for Inflationary Times (Neville, Draaisma, Funnell, Harvey and Van Hemert — Man Group and Duke University, 2021). It examined eight US high-inflation regimes since 1926. Shares averaged a real return of about −7% a year during those regimes, against roughly +10% a year at other times. Nominal bonds and credit also lost in real terms. Traded commodities were the standout at about +14% a year in real terms, with gold and silver in the low teens. Residential property roughly held its value, averaging about −2% in real terms.
Two caveats matter for an Australian reader. First, those regimes were far more severe than today's 4% inflation — the lesson is about direction, not magnitude. Second, the ASX is unusually commodity-heavy, so the local share market carries more built-in inflation protection than the US market in that study, through miners and energy producers. Against that, the ASX's biggest sector is banks, whose fortunes are tied to the housing market and credit growth.
Asset by asset: recession versus stagflation
| Asset | If recession | If stagflation | Where it stands, Oct 2026 |
|---|---|---|---|
| Cash and term deposits | Rates fall; lower income but no capital loss | Rates stay high; real return near zero after tax | Cash rate 4.60%, above trimmed-mean inflation for the first time in years |
| Government bonds | Strong — yields fall, prices rise | Weak — yields rise further | 10-year yield above 5.2% in September, highest since 2011 |
| Australian shares | Weak, especially banks and retailers | Mixed — miners and energy hold up, banks and rate-sensitives suffer | ASX 200 at 8,717 on 9 Oct, about 5% below its February month-end record |
| Listed property (A-REITs) | Fall first, recover early as rates are cut | Weak — priced off bond yields | Already one of the worst-performing parts of the ASX in 2026 (our A-REIT comparison) |
| Residential property | Prices fall, rents soften | Prices flat to falling in real terms, rents rise | Values −5.2% from peak, gross yields 3.85% |
| Gold and silver | Usually firm as rates fall | Historically strong | Gold about A$6,000/oz on 10 Oct 2026 (our silver guide) |
| Commodities and energy | Fall with demand | Historically the best performer | Brent about US$102 in early October, up more than 50% on a year |
Six principles for this kind of market
None of this is personal advice — your age, income, debt, tax position and goals change the answer. But some principles hold across almost every situation when the outlook forks this way:
- Fix cash flow before chasing return. The people who lose most in downturns are those forced to sell at the bottom. A buffer of several months of expenses — ideally in an offset account, where each dollar saves your mortgage rate tax-free — is worth more right now than any market call. Our money management guide covers why staying liquid matters more than picking winners.
- Don't bet the house on one scenario. A portfolio that holds some assets that do well in a recession (high-quality bonds, cash) and some that do well in stagflation (real assets, resources, a modest precious-metals allocation) is boring by design. It is meant to survive whichever fork arrives.
- Be wary of leverage. Margin loans and highly geared property are most dangerous exactly when rates are rising and asset prices are falling. If you are geared, stress-test your repayments at a cash rate of 5.10% — two more rises.
- Lock in some yield while it is there. If the recession path wins, today's 5%+ government bond yields and term deposit rates will look generous in hindsight. Spreading maturities across one to five years captures some of that without betting on timing.
- Keep investing regularly if you can. Downturns are when regular contributions — salary sacrifice into super, a fixed monthly ETF purchase — buy the most units per dollar. The seven-ETF portfolio is a simple base for that.
- Rebalance, don't react. Set target weights and move back towards them when markets swing. It forces you to trim what has rallied and add to what has fallen — the opposite of what fear and greed tell you to do.
Don't sell everything to cash on a recession headline. Markets usually start falling before a recession is confirmed and start recovering before it ends, so selling after the news tends to lock in losses and miss the rebound. And don't treat a commodity or gold position as a substitute for a diversified portfolio — Fig. 4 shows what they did in bad times, not what they do the rest of the time, when commodities have historically lagged shares by a wide margin.
For how the rate outlook itself might evolve over the next five years, see our interest rate forecast, and for the live figures behind this article, the Australian Economic & Investment Dashboard.
Five releases to watch before Christmas
| Date | Release | Recession signal | Stagflation signal |
|---|---|---|---|
| 15 Oct | Labour Force, September (ABS) | Employment falls; unemployment 4.8% or higher | Unemployment rises while hours and wages hold |
| 28 Oct | CPI, September and September quarter (ABS) | Quarterly trimmed mean 0.6% or lower | Quarterly trimmed mean 0.9% or higher |
| 3 Nov | RBA decision and Statement on Monetary Policy | Hold with growth forecasts cut | Rise to 4.85% with inflation forecasts raised |
| Early Nov | Cotality home value index, October | Sharper monthly falls, spreading to regions | Falls continue while rents keep rising |
| Early Dec | National accounts, September quarter (ABS) | A negative quarter of GDP | Weak real GDP alongside a strong GDP deflator |
Above all of these sits the oil price. A durable reopening of the Strait of Hormuz would take the stagflation scenario off the table faster than anything the RBA can do; a further escalation would make it the base case.
The Richer verdict
Is Australia heading for recession? Not on the base case. GDP is still growing, employment is still rising, household balance sheets are solid, and AI and government spending are holding up demand. The probability is real — somewhere between one in four and one in two, depending on who you ask — and it rises with every month the oil shock persists and every rate rise the RBA has to deliver.
Is it stagflation? Not by the 1970s definition, and the RBA is right to resist the label. But the direction of every key variable — flat growth per person, sticky inflation, rising unemployment, falling real wages, rising rates — is stagflationary. Call it stagflation-lite, and treat it as a warning, not a verdict.
What should you do? Prepare for both forks rather than predict one. Strengthen cash flow and buffers, keep leverage modest, hold assets that do well in a recession alongside assets that do well when inflation sticks, and keep investing on a schedule rather than on headlines. The households that come out of slowdowns ahead are rarely the ones that called them correctly — they are the ones that never had to sell. Think in scenarios, stay liquid, and stay Richer.
Frequently asked questions
Is Australia in a recession right now?
No. Real GDP grew 0.4% in the June quarter of 2026 and 2.1% over the year, and the next GDP release, for the September quarter, is due in early December. A technical recession needs two consecutive quarters of falling GDP. However, GDP per person was flat in the June quarter after a small fall in March, so on a per-person basis the economy is close to stalling, and many households are experiencing recession-like conditions.
What is the difference between a technical recession and a per capita recession?
A technical recession is two consecutive quarters of falling total real GDP. A per capita recession is two or more consecutive quarters of falling real GDP per person. Because Australia's population grows quickly, total GDP can rise while output per person falls, so a per capita recession can happen without a technical one — as it did in 2023 and 2024.
Is Australia experiencing stagflation?
Not by the classic definition of very high inflation and very high unemployment, and the RBA Governor rejected the label in September 2026. But the direction of the data — flat growth per person, inflation above target at 4.0% headline and 3.6% underlying, unemployment rising to 4.6% and real wages falling — has a stagflationary shape. "Stagflation-lite" is a fair description.
Will the RBA raise interest rates again?
Possibly. The RBA raised the cash rate to 4.60% on 29 September 2026 and said it would raise again if needed. Deloitte, HSBC and ANZ expect a further rise to 4.85% in November; others expect a hold. The September-quarter CPI on 28 October is the key input to the 3 November decision.
What happens to house prices in a recession?
House prices usually fall when unemployment rises and borrowing capacity shrinks, but forced selling is what turns a correction into a crash. National values were already 5.2% below their March 2026 peak by September. The RBA estimates fewer than 1% of borrowers are in negative equity and only about 2% of variable-rate owner-occupiers have a cash-flow shortfall, which limits forced sales unless unemployment rises sharply.
What investments do best during stagflation?
Historically, commodities, gold and silver, and inflation-linked bonds have held their real value best during high-inflation periods, while shares and conventional bonds have struggled. A study of eight US inflation regimes since 1926 found commodities averaged about +14% a year in real terms and shares about −7%. In a recession without inflation, government bonds and quality shares tend to do better. Because the outcome is uncertain, diversification across both sets of assets is the more robust approach.
Should I sell my shares before a recession?
Trying to time a recession is rarely successful, because markets tend to fall before recessions are confirmed and recover before they end. A better approach for most people is to make sure they hold enough cash that they will never have to sell in a downturn, keep gearing modest, rebalance to target weights and keep investing regularly. This is general information only; consider personal advice for your situation.
Sources
All figures are as at the dates shown and were checked on 13–14 October 2026. Forecasts are the named organisations' opinions at the time and change without notice.
- Australian Bureau of Statistics, Australian economy grew 0.4% in the June quarter, 2 September 2026.
- Queensland Government Statistician's Office, ABS National Accounts: June quarter 2026 summary (GDP per capita), September 2026.
- Australian Bureau of Statistics, Consumer Price Index, Australia, August 2026, 30 September 2026.
- Australian Bureau of Statistics, CPI rose 4.0% in the year to August 2026, 30 September 2026.
- Australian Bureau of Statistics, Unemployment rate rises to 4.6% in August, 24 September 2026.
- Australian Bureau of Statistics, Annual wage growth of 3.2% in June quarter 2026, 19 August 2026.
- Treasurer Jim Chalmers, Wages continue to grow under Labor (real wages −0.8% through the year), 19 August 2026.
- Reserve Bank of Australia, Statement by the Monetary Policy Board: Monetary Policy Decision, 29 September 2026.
- Reserve Bank of Australia, Media Conference: Monetary Policy Decision, Governor Michele Bullock, 29 September 2026.
- Reserve Bank of Australia, Minutes of the Monetary Policy Board Meeting, 29 September 2026.
- Reserve Bank of Australia, Financial Stability Review — Resilience of Australian Households and Businesses, October 2026.
- Cotality, Australian housing values down for sixth straight month in September, 1 October 2026.
- Deloitte Access Economics, Business Outlook: Risks are becoming reality, 7 October 2026.
- The Motley Fool Australia, Australia's recession risk hits 50% as RBA prepares to lift rates (HSBC, citing The Australian), 28 September 2026.
- ABC News, Australia's economic slowdown is just beginning, economists warn (AMP, Oxford Economics Australia), 4 June 2026.
- Trading Economics, Australia consumer sentiment weakens for 2nd straight month (Westpac–Melbourne Institute index 80.4), 6 October 2026.
- US Energy Information Administration via Hellenic Shipping News, EIA raises Brent outlook on Hormuz shipping constraints, August 2026.
- MoneyMagpie, Oil price prediction October 2026 (Brent ~US$102.60 on 5 October, citing Trading Economics), October 2026.
- Reserve Bank of Australia, Australian Monetary Policy in the Last Quarter of the Twentieth Century, Governor Ian Macfarlane, 15 September 1998.
- HLB Mann Judd, What is stagflation? (CPI peak of 17.7% in March 1975).
- Neville, Draaisma, Funnell, Harvey and Van Hemert, The Best Strategies for Inflationary Times, Journal of Portfolio Management, 2021.
- Macro Hive, Trading during inflationary times (gold, silver and residential property real returns).
- Trading Economics, ASX 200 ends week 0.4% higher (close of 8,717 on 9 October 2026); CEIC, S&P/ASX 200 month-end record of 9,198.6, February 2026.
- Karmactive, Australia 10-year bond yield reaches 5.16%, highest since April 2011, 2 September 2026.
- PriceGold.net, Gold price on 10 October 2026 (A$6,005.75 per ounce).
Keep reading
James Zhang writes richer.au's Property, Shares and Wealth coverage. He has invested through more than two decades of Australian rate cycles — including the 2008 crisis, the 2020 recession and the 2022–23 hiking cycle — across residential, commercial and development property and listed markets.
General information only. This article is general information, not personal financial, investment, taxation or legal advice, and doesn't account for your objectives, financial situation or needs. The scenario weights and the "stagflation-lite" description are the author's judgement from published figures, not forecasts. Economic forecasts quoted are those organisations' opinions at the dates shown and change without notice. Figures are sourced and dated as shown and can change. Past performance is not a reliable indicator of future performance. Richer Online Pty Ltd (ABN 62 159 604 949) does not hold an Australian Financial Services Licence and has no commercial relationship with any organisation named. Consider seeking advice from a licensed financial adviser, accountant or lawyer before acting. See our Terms of Use or get in touch.
Get richer, one decision at a time
New articles as they land.
Property, shares, commodities and tax strategy — worked examples with real Australian figures and no product spruiking. One email when something new goes live.
No spam · unsubscribe any time