2700 · Thematic investing
Ore in. Finished goods out?
Robots are shrinking the labour-cost gap that sent Australian ore offshore to be made into things. What that could mean for factories, jobs, migration, property and the ASX — and why an Australian win is far from guaranteed.
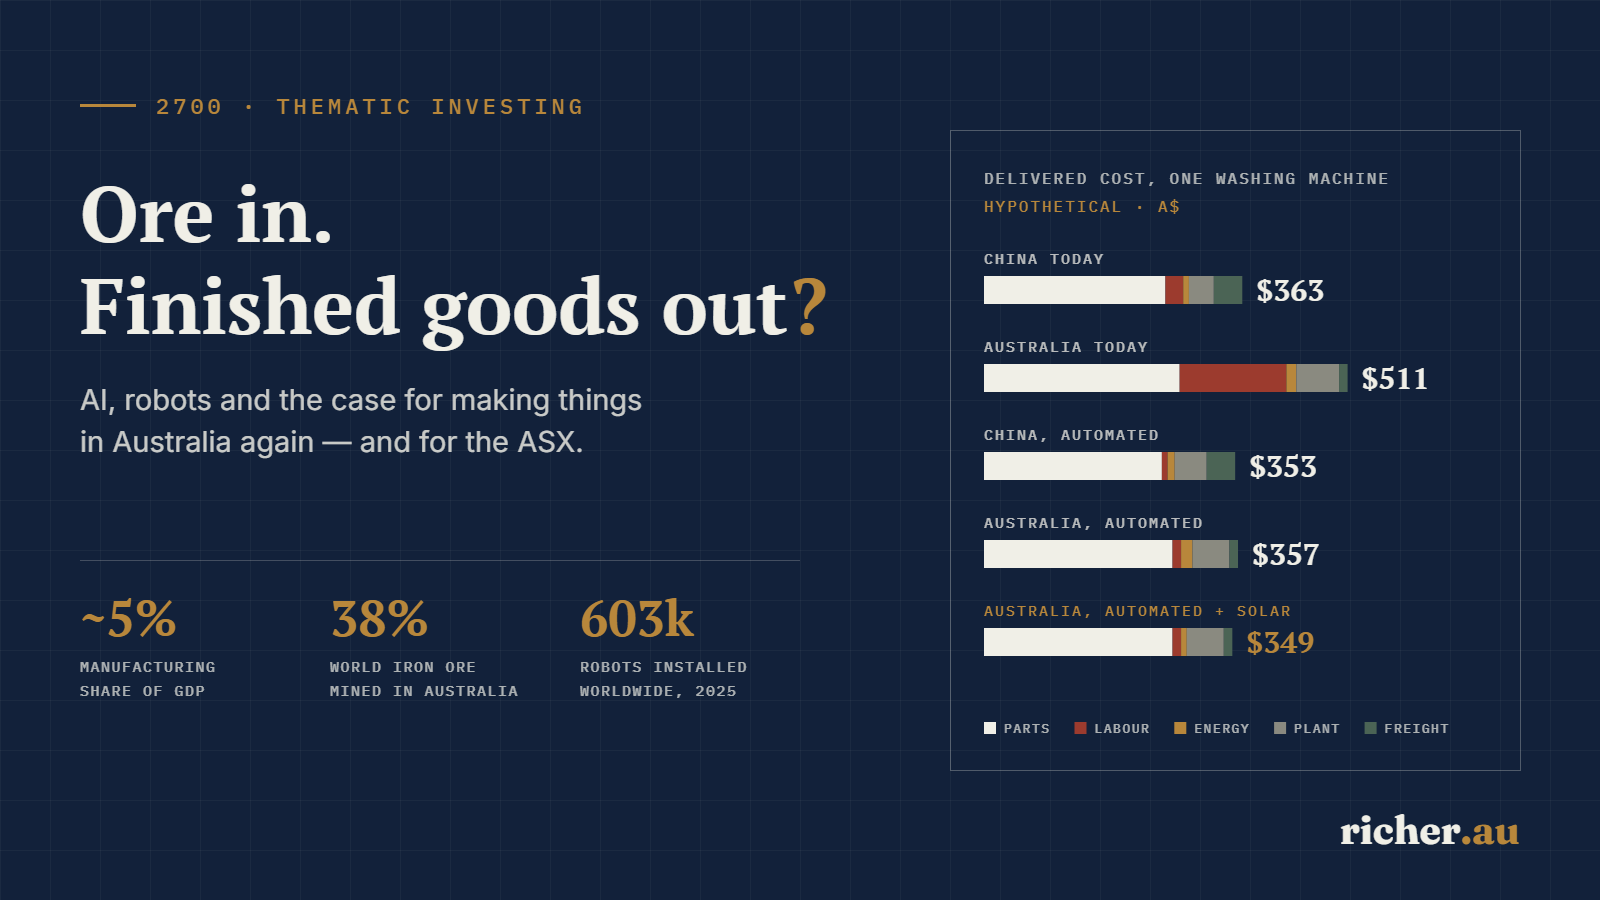
For sixty years the ore went north. What if it stopped?
Every year Australia digs up close to a billion tonnes of iron ore, loads most of it onto ships at Port Hedland and Dampier, and sends it eight to twelve days north to China. There it becomes steel, then car bodies, washing machines, rail track and scaffolding — some of which comes back to Australia in a container. The same is true, in different proportions, of our lithium, bauxite, copper and rare earths. Resources and energy exports earned about A$403 billion in 2025–26. Manufacturing, meanwhile, has shrunk to roughly 5% of the economy, from about 30% at its early-1960s peak.
The reasons are well rehearsed: cheaper labour in Asia, enormous scale, clusters of suppliers that took decades to build, and cheap energy. But one of those reasons — labour — is the one that robots attack directly. A Chinese factory worker costs roughly a quarter of an Australian one. A robot costs much the same in Wollongong as it does in Wuxi.
So here is the question this article tests. If robots eventually do most routine factory work for less than people do, does it still make sense to ship Australian resources thousands of kilometres to be manufactured elsewhere? Or could a country that already owns the ore, the land, the sun and the wind, and has stable institutions and deep capital markets, start turning more of its raw materials into finished goods — and what would that mean for jobs, migration, property and the ASX?
This is a conditional, long-range scenario, not a prediction. The honest answer, as you will see, is "for some products, under some conditions". Every figure below is dated and sourced, and every hypothetical number is labelled as one.
- Could robotics reverse globalisation?
- How close are we to robotic factories?
- Why the resources matter — and why they are not enough
- Could making it here beat making it in China?
- Which industries could benefit most
- Which states could benefit most
- Would robots cause mass unemployment?
- Could Australia need far fewer migrants?
- What it could mean for property
- ASX companies that could benefit
- Individual shares or an ASX 200 ETF?
- Three possible futures for 2045
- The investment takeaways
- The Richer verdict
- Frequently asked questions
Could robotics reverse globalisation?
Globalisation moved factories to where the combination of labour, energy, suppliers and customers was cheapest. For most mass-produced goods since the 1990s, that meant East Asia, and above all China. Labour was never the only reason — but it was the reason everyone could see, and it was large enough to swamp the cost of shipping raw materials one way and finished goods the other.
Automation changes the arithmetic in one specific way. If a robot cell can do the work of a production line of people, the labour line in a product's cost shrinks towards zero in every country, and the wage gap between countries stops mattering as much. What is left to compete on is everything else: the price of energy, the cost of materials and parts, the cost and speed of capital, proximity to customers, the cost of moving things around, and the depth of the supplier network.
That is where the Australian case comes from. In a world where cheap labour matters less, a country with abundant resources, large amounts of land, world-class solar and wind, stable rule of law and one of the world's largest pools of retirement savings is better placed than it was in a world where cheap labour was decisive. Better placed is not the same as winning, and the rest of this article is about the difference.
Historical figures and current company data are facts, sourced at the end. The idea that automation erodes labour-cost advantages is standard economic theory. The three futures, the washing-machine cost example and the migration paths are scenarios — illustrations of how the pieces fit together, not forecasts. Where the author is making a judgement, the text says so.
How close are we to robotic factories?
It helps to separate two very different kinds of robot.
Industrial robots: already everywhere, just not here
Fixed industrial robots — the arms that weld car bodies, palletise cartons and place components on circuit boards — are a mature technology. The International Federation of Robotics counted 603,307 installed in 2025 and about 5.08 million in operation worldwide. China alone installed 354,226, and Chinese suppliers now make more than half of the robots sold in China. The average value per robot implied by IFR's US$18.6 billion market figure is about US$31,000 (author's arithmetic) — far less than one year of an Australian factory wage.
Robot density tells the story of who is using them. On IFR's latest figures (2024 data), the world average is 132 robots per 10,000 manufacturing workers; South Korea has 1,220, Singapore 818, Germany 449, Japan 446 and the US 307. IFR does not publish an Australian figure, but the Robotics Australia Group's 2022 roadmap found Australia had slipped from 18th to 35th of 37 countries on manufacturing robot density, and that Australia makes no industrial robots of its own. Australia's starting point is low. That cuts both ways: it is a measure of how far behind we are, and of how much productivity there is to gain.
Where Australia does lead is in mining. Australia runs more than 1,000 autonomous haul trucks — about a quarter of the world's fleet on GlobalData's 2025 count — and Rio Tinto's AutoHaul network runs up to 53 driverless iron ore trains at once across 2,000 km of Pilbara track. Australians already know how to run heavy automation in remote places at scale.
Humanoid robots: real, but early
General-purpose humanoids are the part of the story that attracts the headlines, and where claims run furthest ahead of evidence. Here is where the main players actually stood in October 2026.
| Company | Where it is | Stage |
|---|---|---|
| Tesla Optimus (US) | Says early production has started on a high-volume Fremont line; ramp to that line's rate will take at least a year; no outside sales; external deliveries likely late 2027 (21 Oct 2026) | Pre-commercial |
| Figure AI (US) | Valued at US$39bn (Sep 2025); says it has built more than 1,000 Figure 03 units; Figure 02 supported production of 30,000+ BMW X3s at Spartanburg in 2025; Figure 03 now in BMW logistics, count undisclosed | Pilot / early deployment |
| Unitree (China) | Listed on Shanghai's STAR Market Aug 2026; FY2025 revenue CNY1.70bn, profitable; 5,500+ humanoids shipped in 2025; G1 listed at US$13,500 | Commercial (research, education, light duty) |
| UBTech (China) | 921 full-size humanoids shipped in 1H 2026 to factories including BYD, Geely and Foxconn; still loss-making | Early commercial |
| Agility Digit (US) | Working at GXO, Schaeffler and others; 2025 sales just US$1.78m; listing via a SPAC at US$2.5bn | Small-scale commercial |
| Boston Dynamics Atlas (US) | Training centre at Hyundai's Georgia plant doing parts sequencing; Hyundai plans tens of thousands of units over coming years | Pilot |
The pattern is clear. Tens of thousands of humanoids are being built; very few are yet doing reliable, paid, unsupervised factory work. Most deployments are carefully chosen tasks — moving totes, sequencing parts — in controlled settings. Forecasts are enormous: Goldman Sachs projects 6.5 million humanoid shipments a year by 2035, and Bank of America expects the bill of materials for a Chinese-made humanoid to fall from about US$35,000 to under US$17,000 by 2030. Those are forecasts, not facts, and Elon Musk's long-range claims for Optimus — including that it will eventually cost less than a car — belong in the same category.
The more important development is less visible: AI-based vision and manipulation are letting ordinary industrial robots handle variable parts, mixed products and short runs that used to need people. Xiaomi's Beijing smartphone plant, opened in 2024 with capacity for 10 million phones a year running around the clock, shows what a heavily automated line can do — though the "fully lights-out" label applied to it in the media goes further than the evidence. Even in China, no mass-production car plant yet runs final assembly without people.
Three ways the next 20 years could go
| Scenario | What robots can do | Economic consequence |
|---|---|---|
| Conservative | AI and robotics steadily automate more manufacturing tasks; humanoids stay niche | Productivity rises, labour still matters; Asia keeps most mass manufacturing; Australia gains in already-automated, resource-linked processing |
| Moderate | Robots perform most routine factory operations economically, with people supervising and maintaining | The labour-cost gap between countries narrows sharply; energy, materials, capital and freight decide location; selective reshoring becomes viable |
| Transformational | Robots perform most physical work, including manufacturing and construction, with minimal supervision | Wages stop setting where things are made; resources, energy, land and capital dominate; huge questions about jobs and the distribution of income |
None of these is assigned a probability here. The point of setting them out is that the investment implications differ — and that the first is already happening.
Why the resources matter — and why they are not enough
Australia's resource base is genuinely world-scale. The question is what each raw material could become if more of it were processed and made into things here.
| Australian resource | Australia's position | Potential finished products |
|---|---|---|
| Iron ore | ~38% of world output (2025) | Steel, machinery, vehicles, rail, construction products |
| Bauxite | ~22% of world output; also alumina | Aluminium, building components, transport equipment |
| Lithium | ~32% of world output | Battery chemicals, cells, energy storage systems |
| Copper | Export earnings ~A$13–14bn (2025–26) | Cables, motors, transformers, industrial equipment |
| Rare earths | ~7% of output; large reserves (6.3 Mt) | Permanent magnets, motors, electronics |
| Gold and other metals | Gold exports ~A$70bn (2025–26) | Electronic contacts, connectors, components |
| Silica | High-purity deposits in several states | Glass, solar-grade and semiconductor-grade silicon |
| Agricultural commodities | A leading exporter of grain, beef, dairy, wool | Processed, packaged and premium foods |
But owning the ore does not make the finished product cheaper, for four reasons that matter more than the rhetoric usually admits.
First, opportunity cost. Iron ore trades at a world price. A BHP or Rio Tinto tonne used in a domestic steel mill is a tonne not sold to China at that price, so the mill pays roughly the world price either way. The saving from local ore is mostly the freight, not the ore itself.
Second, energy. Turning ore into metal is an energy business. Aluminium smelting and steelmaking are among the most power-hungry industries on earth, and lithium refining is chemically complex as well as energy-intensive. Australia's wholesale power has fallen to A$63/MWh on average in the September quarter, but delivered industrial prices include network charges, and parts of China pay contract prices of 0.24–0.39 yuan per kWh (roughly A$50–80/MWh). There is no clean, like-for-like comparison, and that is itself a warning.
Third, processing know-how. Australia's recent lithium refining experience is sobering. Albemarle idled its Kemerton hydroxide plant in February 2026. IGO wrote off its stake in the Tianqi joint venture at Kwinana and said it saw no pathway to profitability, citing energy and labour costs; the plant's first train produced about 15% of nameplate in the June quarter. Covalent's Kwinana refinery did produce its first hydroxide in 2025. Automation alone does not solve chemistry, scale-up or a commodity price collapse.
Fourth, supplier networks and scale. A modern factory depends on hundreds of suppliers within trucking distance. China has them; Australia, for most products, does not.
Could Australia assemble smartphones competitively with cheap robots? Assembly, perhaps — it is exactly the kind of repetitive, precise work automation is good at. But assembly is a small share of a phone's value. The expensive parts are advanced chips made in a handful of fabs in Taiwan, Korea and the US; OLED displays made mostly in Korea and China; camera modules, batteries and precision mechanical parts from dense supplier clusters; and patents and software owned by a few companies. A robotic assembly plant in Australia would still import nearly every component. Phones are the clearest case of a product where cheap robots do not overcome the absence of an ecosystem.
Could making it here beat making it in China?
This is the core of the argument, so it is worth being precise about the whole supply chain rather than any single cost.
Domestic manufacturing in a highly automated world could save money in several places:
- Freight both ways. No ocean leg for the raw material and none for the finished good. This matters most for heavy, bulky, low-value-per-tonne products.
- Labour. The largest single gap today, and the one robots compress.
- Inventory and working capital. Goods that spend six to ten weeks in transit and warehouses tie up cash; local production cuts weeks of stock to days.
- Speed and flexibility. Shorter lead times mean less forecasting error, fewer stock-outs and less discounting of the wrong product.
- Construction costs. If robots and prefabrication also cut the cost of building factories, Australia's high construction costs — a real barrier today — would shrink too.
To see how these combine, take a hypothetical washing machine sold in Australia. The figures below are illustrative, chosen to be internally consistent with the wage gap and freight costs above. They are not measured costs of any real product.
| Hypothetical, A$ per unit | China today | Australia today | China, automated | Australia, automated | Australia, automated + own solar |
|---|---|---|---|---|---|
| Materials and parts | 255 | 275 | 250 | 265 | 265 |
| Labour | 25 | 150 | 8 | 12 | 12 |
| Energy | 8 | 14 | 10 | 16 | 8 |
| Factory, robots and overhead | 35 | 60 | 45 | 52 | 52 |
| Freight, duty and stock in transit | 40 | 12 | 40 | 12 | 12 |
| Delivered cost | 363 | 511 | 353 | 357 | 349 |
Assumptions: Australian factory labour about six times Chinese per unit today, falling to a few dollars once most tasks are automated; Australian parts dearer because more are imported and volumes are smaller; robots cost about the same in both countries, but Australian buildings, maintenance labour and smaller volumes keep automated factory overhead about $7 a unit higher; Australian grid energy dearer, with the solar case assuming on-site solar and batteries roughly halve the energy cost; freight, handling and transit inventory about $40 a unit from China against $12 for local distribution. All figures hypothetical.
Three things stand out. Today, an Australian-made washing machine would cost about 40% more. After automation, the gap almost disappears — from $148 a unit to $4. The robots themselves cost much the same in both countries, so the factory lines converge; what is left is Australia's dearer buildings, maintenance labour and smaller scale against China's cheaper parts and grid power. On grid power, China stays a whisker ahead. Robots remove Australia's biggest handicap; on their own, they do not hand Australia a lead.
What if the factory runs on its own solar?
Energy is the one line where Australia could plausibly finish in front. It has some of the best solar and wind resources of any industrial economy, and the grid is already showing what that does to prices. Wholesale power averaged A$63/MWh in the September quarter, the lowest third quarter since 2021; renewables supplied a record 44% of generation in the National Electricity Market; and grid batteries now soak up cheap midday power and release it in the evening, setting the price in nearly half of all dispatch intervals. CSIRO's GenCost 2025–26 report found battery costs fell 11–16% in a year, and electricity futures point to baseload prices of roughly A$68–92/MWh over the next three years.
A robotic factory suits this unusually well. Robots do not mind when they work, so production can lean into the middle of the day, when solar pushes wholesale prices towards zero, with on-site panels and batteries covering much of the load. In the example, halving the energy bill — from $16 to $8 a unit — takes the Australian machine to $349, $4 cheaper than the automated Chinese one.
Three cautions. Energy is a small share of a washing machine's cost, so the effect here is modest; it matters far more for energy-hungry products such as aluminium, green iron and battery chemicals, where electricity is commonly a third or more of production costs. A plant running around the clock still needs firmed power at night, and delivered prices carry network charges that cheap generation does not remove. And China is the world's largest maker and installer of solar panels, so cheap renewables are not an Australian monopoly. The point is not that Australia wins on energy automatically, but that energy is the lever most likely to decide the close calls.
What about Vietnam and India?
Vietnam and India are where many manufacturers have moved, or added, production to reduce their reliance on China — the so-called "China plus one" strategy. Their main advantage is labour. Vietnam's manufacturing workers earned an average of about US$364 a month in early 2025, and India's factory sector paid average emoluments of roughly ₹32,000 a month per person engaged in 2024–25 (author's calculation from the Annual Survey of Industries, which counts managers as well as workers). Both are a fraction of China's urban manufacturing average of about ¥9,500 a month, and around a fifteenth of Australian manufacturing earnings. Against that, both import many components from China, have thinner supplier networks and ship further to Australia — India especially.
| Hypothetical, A$ per unit | Vietnam today | Vietnam, automated | India today | India, automated |
|---|---|---|---|---|
| Materials and parts | 265 | 262 | 275 | 272 |
| Labour | 14 | 6 | 14 | 6 |
| Energy | 9 | 10 | 11 | 12 |
| Factory, robots and overhead | 36 | 47 | 40 | 50 |
| Freight, duty and stock in transit | 40 | 40 | 46 | 46 |
| Delivered cost | 364 | 365 | 386 | 386 |
Assumptions: Vietnamese and Indian wages roughly a third of China's urban manufacturing average, partly offset by lower output per worker; more components imported from China, raising parts costs; smaller plants, so robots and buildings are spread over fewer units; freight to Australia about the same as from China for Vietnam and higher for India, given the longer voyage. Robots cost the same everywhere. All figures hypothetical.
The result is the most surprising finding in this exercise. Automation helps Vietnam and India least, because their labour was already cheap. Today a Vietnamese-made machine costs about the same as a Chinese one, and an Indian-made one a little more, because cheap labour offsets dearer parts and longer freight. Once robots do the work, that offset disappears: Vietnam slips behind China, India stays the dearest of the Asian producers, and Australia — which had the most labour cost to remove — gains the most. In a robotic world, the "China plus one" economies lose their main selling point faster than Australia loses its handicap.
Two caveats matter. Both countries are building deeper supplier networks quickly — India's production-linked incentive schemes have already drawn large-scale smartphone assembly, for example — and both have large, fast-growing home markets that this Australia-delivered example ignores. And because Australia has free trade agreements with China, the ASEAN countries and India, import duty makes little difference to any of these comparisons.
Where China is still likely to win
- Products with deep component ecosystems — phones, laptops, most consumer electronics, cars at volume.
- Products where scale is everything — when one Chinese plant makes more units than the entire Australian market buys.
- Where China's energy is cheaper — in provinces with low contract power prices and state-backed supply.
- Where China automates just as fast — which, on current installation numbers, it is doing.
Where Australia could genuinely compete
- Heavy, bulky goods with low value per tonne — structural steel, fabricated sections, aluminium extrusions, building products, prefabricated housing. Freight is a large share of their cost.
- First-stage processing next to the resource — green iron, alumina, battery chemicals and rare earth oxides, if renewable power is cheap at the site and government incentives hold. The federal Critical Minerals Production Tax Incentive, a 10% refundable offset on eligible processing costs from 1 July 2027, is now law.
- Perishable and premium food — where freshness, provenance and biosecurity matter.
- Customised, short-run and urgent products — where speed beats unit cost: spare parts, mining equipment components, made-to-order fabrications.
- Sovereign and defence supply chains — where governments will pay for security of supply.
The lesson is that the reshoring opportunity is real but selective. It is strongest where Australia's resources, energy and distance to customers line up — and weakest exactly where the popular imagination puts it, in smartphones and consumer electronics.
Which industries could benefit most
Putting the pieces together — resource advantage, how much labour automation can remove, how energy-hungry the process is, and how deep the supplier problem runs — gives a rough ranking. The ratings below are the author's qualitative judgements, not measured scores.
| Industry | Resource edge | Labour saving | Energy need | Supply hurdle | Local potential | Robots today |
|---|---|---|---|---|---|---|
| Steel and metal fabrication | Strong | Medium | Very high | Low–medium | High | Yes: welding |
| Aluminium and building products | Strong | Medium | Very high | Low | Medium–high | Yes: extrusion |
| Battery materials and mineral processing | Strong | Low–medium | High | High | Medium | Process control |
| Consumer appliances | Weak–medium | High | Medium | High | Low–medium | Yes: assembly |
| Cars and components | Medium | High | Medium | Very high | Low | Yes: body shops |
| Phones, computers, electronics | Weak | High | Medium | Extreme | Low | Partly |
| Food processing and groceries | Strong | High | Low–medium | Low | High | Yes: packing |
| Pharmaceuticals and medical devices | Weak | Medium | Low | Medium | Medium | Yes: packaging |
| Precision engineering, defence, aerospace | Medium | Medium | Low | Medium | High | Yes: CNC |
Main hurdles: battery materials — processing chemistry and know-how; appliances — motors, chips and plastics; electronics — chips, displays and intellectual property; pharmaceuticals — regulation and intellectual property. Local potential for cars is in niches and components; for pharmaceuticals and defence it rests on sovereign demand.
Two groups emerge. Steel and metal fabrication, aluminium and building products, food processing, and precision and defence engineering all combine a local resource or customer advantage with robotics that already works today — welding cells, CNC machining, automated inspection, packing and palletising. They need cheaper energy and better scale, not a technological miracle.
Consumer appliances, cars and electronics are the opposite. Robots already do much of their assembly, but Australia has little resource advantage in what goes into them, and the supplier gap is enormous. They need the Transformational scenario — and probably more — before local production makes sense beyond niches. Battery manufacturing sits in between: Australia has the lithium, but the Kwinana and Kemerton experience shows that the hard part is processing chemistry and price cycles, not labour.
Which states could benefit most
The opportunity is not spread evenly. It follows the resources, the power, the ports and the existing industrial base. There is no credible statistical ranking of states for a scenario this speculative, so the comparison below is qualitative.
| State | Main advantages | Most plausible opportunities | Watch-outs |
|---|---|---|---|
| Western Australia | Iron ore, lithium, bauxite, nickel, rare earths; world-leading mining automation | Green iron, battery chemicals, rare earths (Kalgoorlie, Eneabba), automated processing at Kwinana and in the Pilbara | Lithium refineries idled; high construction and labour costs; distance from east-coast customers |
| New South Wales | Largest economy, data centres, Western Sydney logistics, Port Kembla steel, Tomago aluminium | Advanced manufacturing, automation services, electrical equipment, AI infrastructure | Land and housing costs; grid connection queues |
| Queensland | Coal and metals, agriculture, Gladstone's alumina and aluminium industry | Food processing, mineral processing, mining equipment and services | Exposure to coal transition; distances |
| Victoria | Deepest manufacturing base, engineering, pharmaceuticals, food; Vic/Tas lowest wholesale power in Q3 | Precision manufacturing, medical devices, food, automation integration, data centres | Few local resources; gas supply |
| South Australia | Defence shipbuilding, autonomous systems, Spencer Gulf industrial region, strong renewables | Green iron and steel at Whyalla, defence manufacturing, AI compute at Port Augusta | Whyalla's blast furnace declared beyond repair; ownership still unresolved |
| Tasmania | Hydro power, Bell Bay aluminium, premium food | Renewable-powered specialised manufacturing, food processing | Small market; Bell Bay reportedly outside the green aluminium credit as designed |
| NT and ACT | NT: critical minerals, gas, proximity to Asia. ACT: research and defence | NT: processing hubs. ACT: AI research, defence technology | Small populations and workforces |
Western Australia has the strongest raw-material case and the most experience with automation at industrial scale — more than 1,000 autonomous trucks, the world's largest driverless rail network, and Fortescue's contract for 360 battery-electric autonomous Liebherr trucks to be delivered to 2030. It also has the clearest warnings. Two lithium hydroxide plants at Kwinana and Kemerton were idled within two years, and IGO blamed energy and labour costs. Iluka's Eneabba rare earths refinery, backed by a A$1.65 billion federal loan, and Lynas's Kalgoorlie plant show that processing can be built — with patient capital and government support.
New South Wales and Victoria have the largest existing industrial bases, the most engineers and the biggest customer markets. In absolute dollars, most of any reshoring gain would probably land here, because that is where the customers, data centres and supplier networks already are. NSW also holds two of the country's most strategically important heavy-industry sites: BlueScope's Port Kembla steelworks, where a roughly A$1.3 billion blast furnace reline is under way, and the Tomago aluminium smelter, secured in August 2026 by a A$2.5 billion federal–NSW support package. Victorian data-centre demand on the grid nearly doubled in the September quarter, to about 225 MW.
Queensland combines mining, agriculture and Gladstone's processing industries, which makes food and mineral processing its most natural opportunities.
South Australia has the most to gain proportionally and the most to lose. Whyalla supplies about three-quarters of Australia's structural steel, but its blast furnace was declared permanently beyond repair on 14 September 2026 and about 500 jobs are being cut. Governments have pledged almost A$2 billion towards a new owner's electric arc furnace, with a preferred bidder now expected before Christmas. A successful green iron and steel rebuild, together with defence shipbuilding and projects like the AI factory planned near Port Augusta, could transform the Upper Spencer Gulf. A failed one leaves the country reliant on imported structural steel for years. The region's housing story is covered in our Port Augusta analysis.
Tasmania has cheap, clean hydro power but a small market; it is best suited to specialised, energy-intensive niches and premium food. The Northern Territory could host processing hubs near critical minerals and Asian shipping lanes, and the ACT contributes research and defence technology rather than factories.
The short version: NSW and Victoria would probably gain most in absolute terms; WA, SA, Queensland and Tasmania could gain most relative to the size of their economies — if the energy and processing problems are solved.
Would robots cause mass unemployment?
The uncomfortable possibility in any reshoring story is that factory output rises and factory employment does not. A robotic steel fabrication plant or food processing line might produce several times as much as the plant it replaces with a fraction of the workforce. Reshoring and re-employment are not the same thing.
| Occupation | Likely exposure | What probably changes |
|---|---|---|
| Factory process workers | High | Routine assembly, packing and handling automated first; remaining roles supervise and maintain |
| Warehouse and logistics | High | Picking, packing and sorting already automating; humanoids target the rest |
| Truck drivers | Medium–high | Mine sites and fixed routes first; public roads later and slower |
| Construction workers | Medium | Prefabrication and printed walls cut on-site labour; complex fit-out stays human longer |
| Agricultural workers | Medium | Autonomous machinery and robotic harvesting spread crop by crop |
| Office and administrative | Medium (from AI software, not robots) | Generative AI augments most roles; some routine roles shrink |
| Engineers, electricians, robot technicians | Demand rises | Someone has to design, install, power, program and fix the machines |
The evidence so far is less dramatic than the headlines. Jobs and Skills Australia's 2025 study of generative AI found only about 4% of the workforce has high exposure to automation, against about 31% with high exposure to augmentation, and no current evidence of widespread displacement. An RBA survey of 105 firms found about half expect AI to reduce headcount slightly over three years, but large-scale job losses were not expected. The Productivity Commission estimates AI could add about A$116 billion to GDP over a decade. Those studies are mostly about software, not physical robots — the robot wave is earlier.
Economists distinguish occupational displacement — particular jobs disappearing — from permanent unemployment, which has never followed past waves of automation, because falling prices raise real incomes and new kinds of work appear. Farm employment fell from a large share of the workforce to a few per cent over the twentieth century without permanent mass unemployment. But transitions can be long and painful for the people and towns caught in them, as Australia's car-industry closures showed.
The deeper question is the one the Transformational scenario forces: if robots produce most goods and services, how do households earn the income to buy them? There are only a few answers — shorter working weeks, a larger share of income from owning capital rather than selling labour, a tax system that shifts from wages towards profits, resources and land, and public services funded from that base. Australia has an unusual head start on one of them: compulsory superannuation already makes most workers part-owners of listed companies. In a robotic economy, the gap that matters most may not be between the employed and the unemployed, but between those who own a slice of the machines and those who do not.
Could Australia need far fewer migrants?
Much of Australia's recent population growth has been justified by labour shortages. Net overseas migration was 292,100 in the year to March 2026, and the 2026–27 permanent Migration Program is set at 185,000 places, about 132,000 of them skilled. If robots could build houses, pick fruit, run factories and help in aged care, the labour-shortage argument for high migration would weaken.
A highly automated Australia could, in principle, sustain a strong economy with a smaller workforce than it would otherwise need. Ageing makes that more relevant, not less: the 2023 Intergenerational Report projected the share of Australians aged 65 and over rising from 17.3% to 23.4% by 2062–63, with the number of working-age people for each older Australian falling from 3.7 to 2.6. Robots in aged care and health could ease that pressure.
But migration policy is not a labour-market calculator. It also reflects family reunion, humanitarian obligations, universities, the tax base needed to fund an ageing population, and politics. Skilled migrants in research, engineering and entrepreneurship would likely be in more demand in a robotic economy, not less. The Budget forecasts net overseas migration of 245,000 in 2026–27 and 225,000 in 2027–28, and the 2026 Intergenerational Report assumes about 235,000 a year in the long run.
| Illustrative path — not a forecast | Migration | Population growth | Why it might happen |
|---|---|---|---|
| Status quo | Near official assumptions | Steady | Automation is gradual; skill shortages persist in trades, health and care |
| Automation-moderated | Lower skilled intake in routine trades; higher in engineering and research | Slower | Robots fill some shortages; policy shifts the mix rather than the total |
| Robotic economy | Labour-shortage case largely gone; family, humanitarian and talent streams continue | Much slower | Output no longer tied to workforce size — but politics, ageing and revenue still shape the intake |
What it could mean for property
This is where the robot story cuts both ways for Australian property investors, and where it is easiest to assume too much.
Residential: cheaper to build, possibly slower to fill
Robotics could lower construction costs, which have been one of the main brakes on housing supply. The early evidence is modest but real: Contec printed the walls of a multi-storey concrete home in Perth in about 18 hours, with the full build taking five months; Luyten has a printed multi-storey home under way in Melbourne; and FBR's Hadrian robot completed its first on-site demonstration build in Western Australia on 5 October 2026. Prefabrication and automated construction, at scale, would add supply.
At the same time, lower migration would reduce population-driven demand, and a smaller or more unequal workforce could weigh on household incomes and borrowing capacity. The likely result is divergence rather than a single trend. Well-located, land-constrained suburbs in the capitals — where land, not construction, sets the price — are the least exposed to cheaper building. Outer-suburban and regional estates, where construction is most of the price and new supply is easiest to add, are the most exposed. Our guide to what property to buy in 2026 makes the same case for land value on different grounds.
Industrial: the clearest beneficiary — with a catch
Industrial property is already tight. JLL put national industrial vacancy at 4.6% in the September quarter 2026, with prime space at 3.7% and record take-up of 1.49 million square metres; CBRE measured 3.2% in the first half. More domestic manufacturing would add demand for factories — especially sites with large, reliable electricity connections. AEMO forecasts data centres alone will grow from about 3% of grid consumption in 2025–26 to about 13% by 2035–36.
The catch is that automation also raises output per square metre. A robotic plant can run 24 hours a day in less space than the conventional plant it replaces, and older, low-clearance industrial buildings without power capacity may become obsolete rather than in demand. Location and power will matter more than floor area.
Regional: industry does not automatically mean people
Perth and the Pilbara, Western Sydney, regional Queensland, Whyalla and Port Augusta are all plausible winners from more processing and manufacturing. But a highly automated processing plant employs far fewer people than a 1970s steelworks. The Pilbara already shows the pattern: some of the world's most productive mines support small resident populations, because automation and fly-in, fly-out work keep head counts low. Industrial production growth does not automatically translate into population growth, and population growth does not automatically translate into price growth. Investors should look for the jobs and the housing pipeline, not just the factory announcement.
ASX companies that could benefit
There is no ASX-listed company that makes humanoid robots, and only two small listed robotics developers. The more investable exposure is to the things any robotic, electrified, reshored economy needs: electrical equipment and contractors, grid builders, materials processors, industrial land with power, and the engineering firms that build plants. The table lines up the main candidates on the same measures, using prices at the close on Friday 23 October 2026 and the latest full-year results.
Established, profitable companies
| Ticker | Exposure | Price | Mkt cap | P/E | Yield | Net debt | Read |
|---|---|---|---|---|---|---|---|
| IPG | Direct | $5.24 | $0.55bn | 17.6× | 2.8% | $16m | Reasonable |
| SXE | Direct | $3.63 | $1.12bn | ~28×ᵘ | 2.8% | ($262m) | Reasonable |
| GNP | Direct | $7.74 | $1.58bn | 28.9× | 0.7% | ($399m) | Full |
| NWH | Indirect | $6.02 | $2.78bn | 15.1× | 3.8% | n/d | Reasonable |
| SGH | Indirect | $39.76 | $16.2bn | 17.6× | 1.6% | $3.67bn | Fair, low growth |
| BSL | Direct | $32.36 | $14.2bn | 16.7× | 4.0%ᵒ | $600m | Not demanding |
| SGM | Indirect | $19.26 | $3.72bn | 13.0× | 1.8% | $358m | Cheap-looking |
| LYC | Direct | $10.71 | $10.8bn | 48.4× | — | ($1.09bn) | Expensive |
| ILU | Direct | $4.96 | $2.14bn | Loss | 1.2% | $1.15bn | An option |
| GMG | Direct | $25.27 | $51.7bn | 19.5×ᶠ | 1.2% | $1.9bn | Premium |
| CIP | Direct | $2.80 | $1.75bn | 15.4×ᶠ | 6.0% | 35% gear | Below NTA |
| CDA | Indirect | $55.20 | $10.1bn | 57.2× | 0.9% | ($36m) | Expensive |
| PWH | Indirect | $11.36 | $1.14bn | 63.9× | 0.7% | $6m | Expensive |
Prices: ASX close, 23 Oct 2026. P/E is trailing, on FY26 underlying (or basic where no underlying is reported) EPS; ᵘ SXE on underlying NPAT, author's estimate (statutory P/E ~151× after a one-off settlement); ᶠ REITs on price to operating EPS/FFO. ᵒ BSL ordinary dividend only; 9.3% including specials, which are largely unfranked. Net debt excludes leases; brackets are net cash; n/d = not disclosed. Market caps are price × shares on issue. "Read" is the author's judgement, not a recommendation. Sources at the end.
Electrification and the grid
A robotic factory is first and foremost an electrical installation. These are the most direct beneficiaries, and they are already benefiting from data centres.
IPG — IPD Group. Distributes and makes power distribution equipment, switchgear, cables (CMI, Platinum Cables) and hazardous-area gear. FY26 revenue rose 16.8% to $414.3m and underlying NPAT 17.9% to $30.9m; data-centre revenue was $71.5m, 17% of the group. At 17.6 times earnings with almost no debt, the valuation looks reasonable for its growth. Risks: gross margin slipped 0.8 points to 33.4% on a heavier project mix, there is no FY27 guidance until the 24 November AGM, and the shares have fallen from $6.24 to $5.24 this month.
SXE — Southern Cross Electrical Engineering. Electrical and instrumentation contractor with $261.5m of cash and no debt. Underlying NPAT rose 24.3% to $39.4m, though statutory profit was just $7.1m after a $46.1m WestConnex dispute settlement. Data-centre revenue of $120m is forecast to triple in FY27 and the order book is a record $810m; guidance is underlying EBITDA of at least $100m. Reasonable on underlying earnings, but contracting is lumpy and disputes happen.
GNP — GenusPlus Group. Builds and maintains transmission and distribution networks — the prerequisite for powering new industrial regions. Revenue rose 70.5% to $1.28bn, the order book is $2.2bn and FY27 EBITDA guidance is $200–205m. At 28.9 times trailing earnings the price is full, but backed by growth and $399m of net cash at June (before $130m drawn for an acquisition).
Materials and processing
BSL — BlueScope Steel. The obvious reshoring name, and the one with the biggest twist. Underlying NPAT doubled to $851.2m in FY26 — but the Australian segment earned only $188m of EBIT against $805m from its North Star mill in Ohio. BlueScope is now mostly an American steel story. At 16.7 times trailing earnings, with first-half FY27 EBIT guidance of $860–960m, it is not demanding. Risks: steel is cyclical, Chinese exports pressure Asian spreads, and the Port Kembla reline (about $1.3bn) has slipped to early FY27. The board rejected a $30-a-share bid from SGH and Steel Dynamics in January.
SGM — Sims. Metal recycler whose underlying NPAT rose from $83.1m to $289.1m. At 13 times earnings it looks cheap, but the growth came from North America and from Sims Lifecycle Services, which decommissions data-centre equipment. ANZ Metal earnings fell 22.7% under pressure from Chinese steel exports. A new Australian electric arc furnace — at Whyalla, for example — would lift local scrap demand.
LYC — Lynas Rare Earths. The largest rare earths producer outside China, now shipping heavy rare earths from Malaysia, with about $1.09bn of net cash and FY26 NPAT of $222.4m. At 48 times earnings it is expensive on profits, priced on strategic value; the shares have fallen about 41% over twelve months, the Texas plant will no longer proceed, Kalgoorlie is still ramping and the long-serving CEO has retired.
ILU — Iluka Resources. A mineral sands business building the Eneabba rare earths refinery (capex $1.7–1.8bn, about 60% complete, commissioning targeted for 2027) with a $1.65bn non-recourse federal loan. Loss-making on a statutory basis, with $1.15bn of net debt, most of it non-recourse. Best seen as an option on Eneabba: very valuable if it runs to plan, painful if it does not.
Industrial property
GMG — Goodman Group. Australia's largest listed property group is turning itself into a data-centre developer: $19.7bn of work in progress, 78% of it data centres, and a 6.4 GW power bank across 16 cities. FY26 operating EPS rose 10.1% and FY27 guidance is 9% growth. At 19.5 times operating earnings, 2.1 times NTA and a 1.2% yield, the market is paying a premium for execution — even after a 25% fall over the year. The risk is heavy development spending and data-centre leasing.
CIP — Centuria Industrial REIT. A pure Australian industrial landlord trading at 0.70 times its $4.01 NTA with a 6.0% yield, 95.2% occupancy and re-leasing spreads of +30%. It is also exploring more than 250 MW of data-centre conversions. It is the most rate-sensitive name here — gearing 34.9%, interest cover 2.4 times, only 54% of debt hedged — so with the cash rate at 4.60% it looks potentially undervalued on assets if rates stabilise, and vulnerable if they keep rising. Our ASX REITs comparison covers the sector in depth.
Industrial services and equipment
SGH — SGH Ltd. Older lists still show it as "SVW", but Seven Group Holdings renamed itself SGH Ltd and changed its ticker in November 2024. It owns WesTrac (Caterpillar dealer in WA and NSW), Boral and Coates. Underlying EPS was flat at 226c and FY27 EBIT guidance is "flat to low single-digit", so at 17.6 times earnings it is fairly valued but not growing. Exposure is indirect, through mining equipment and construction materials.
NWH — NRW Holdings. Mining services, civil construction, processing-plant engineering and, since 2025, electrical contracting through Fredon. Underlying NPAT rose 43.6% to $182.7m and FY27 guidance is EBITA of $320–330m. At about 15 times underlying earnings with a 3.8% yield, reasonable — a builder of the plants any processing boom would need.
Advanced manufacturing
CDA — Codan. Tactical and unmanned-systems radios, Zetron critical communications and Minelab detectors. NPAT rose 69% to $175.2m and unmanned-systems revenue more than doubled. A genuine Australian advanced manufacturer — but at 57 times trailing earnings (about 37 times next year's consensus) it is expensive, priced for continued strong growth.
PWH — PWR Holdings. Precision cooling systems for Formula 1, aerospace and defence, made in Australia, the US and soon Poland. Revenue rose 31% and NPAT 83%. An exemplar of high-value, short-run precision manufacturing — the kind Australia can win — but at 64 times trailing earnings, also expensive.
Speculative robotics developers
| Ticker | What it does | Mkt cap | FY26 revenue | Financial position |
|---|---|---|---|---|
| FBR | Hadrian brick-laying robot; Mantis robotic welder | ~$10m | $0.55m | Cash of $27,814 at 30 June; raised about $4m since; going-concern uncertainty flagged |
| AL3 | Large-format metal 3D printing for the US Navy supply chain | ~$77m | $12.5m | First positive half-year EBITDA; cash about $26.7m |
FBR is the closest thing the ASX has to a pure robotics play, and a cautionary one. Its Hadrian robot completed its first Australian on-site demonstration build on 5 October 2026, it has a A$990,000 conditional US order for a Mantis welder, and it has a share subscription facility in place — but revenue was just $551,558, cash at 30 June was under $28,000 and the share price is down about 82% in a year. AML3D (AL3) is further along commercially, though still small. Both are highly speculative, and anyone investing in either should be prepared to lose their entire stake.
Unitree, China's most commercially successful humanoid maker, listed in Shanghai in August 2026; at CNY624 on 23 October it traded on a trailing P/E of about 388 times. Tesla's valuation already assumes a great deal about Optimus. A company can be right about the technology and still be a poor investment if its success is already in the price — the lesson of our quantum computing stocks analysis applies here too. The suppliers of power, equipment, materials and sites have historically been a steadier way to own a boom than the stars of it.
One more caution applies to the whole list. Several of these stocks — SXE, LYC, ILU, NWH, GNP, CDA — fell sharply in the week to 23 October, and the AI and data-centre theme is already reflected in many of their prices. A company can benefit from robotics and still deliver poor share-price returns if that benefit is already priced in.
Individual shares or an ASX 200 ETF?
The simplest way to own Australian industry is to own all of it. Two low-cost funds do that.
| ETF | Benchmark | Fee | Net assets | Holdings |
|---|---|---|---|---|
| iShares Core S&P/ASX 200 (IOZ) | S&P/ASX 200 | 0.05% | $9.66bn | 200 |
| Betashares Australia 200 (A200) | Solactive Australia 200 | 0.04% | $11.24bn | ~200 |
Net assets as at 23 Oct 2026 (BlackRock, Betashares). A200 tracks a different index provider's top-200 index; returns are close to the S&P/ASX 200 but not identical.
The catch is what the index actually contains. On 23 October 2026, financials made up 34.6% of the S&P/ASX 200 and materials 23.5%; the top ten holdings were 49.5%; information technology was under 2%. Buying the index is mostly buying banks and miners. It captures the "resources" half of this thesis well and the "robots and advanced manufacturing" half barely at all — most of the companies above are small or absent from the top of the index.
Picking individual stocks offers the chance to outperform if you choose the right beneficiaries — and the risk of choosing the wrong ones, of paying too much, or of being right about the trend but early by a decade. Most professional managers fail to beat the index over long periods, as our seven-ETF analysis shows.
A common compromise is a core-and-satellite structure. The illustration below is exactly that — an illustration of the structure, not personal advice or a recommended portfolio.
| Illustration only | Weight | Purpose |
|---|---|---|
| Core: Australian shares index ETF | 40% | Broad exposure, including resources and materials |
| Core: global shares index ETF | 40% | The world's technology, robotics and industrial companies |
| Satellite: electrification and grid | 7% | Equipment suppliers and electrical contractors |
| Satellite: industrial property | 5% | Powered, well-located industrial land |
| Satellite: materials processing | 5% | Steel, recycling, rare earths |
| Satellite: speculative technology | ≤3% | Money you can afford to lose entirely |
Note the global sleeve. The companies building the world's robots, chips and AI are overwhelmingly listed in the US, Asia and Europe, and Australians already have heavy exposure to their own economy through jobs, homes, super and, for many readers, investment property. A robotics thesis held only through ASX shares doubles down on the very concentration most Australian investors should be reducing. Our guide to investing in overseas shares covers how, and at what cost.
Three possible futures for 2045
| By 2045 | A · Gradual automation | B · Major reshoring | C · Robotic economy |
|---|---|---|---|
| Manufacturing output | Roughly flat as a share of GDP | Rises, led by metals, food and building products | Rises sharply; many goods made locally |
| Employment | Slow shift out of routine work | Fewer factory jobs per dollar of output; more technicians and trades | Large displacement; work redefined |
| Wages | Productivity-linked, modest | Higher for skilled trades and engineers; pressure on routine roles | Widening gap unless gains are shared |
| Economic growth | Near trend | Above trend while investment is built | Potentially much higher per person; distribution is the question |
| Migration demand | Similar to today | Lower for some trades, higher for engineering and research | Labour-shortage case for migration weakens |
| Residential property | Population-driven, as now | Stronger in industrial regions; build costs ease | Uncertain: cheaper building, slower population growth, income questions |
| Industrial property | Logistics-led | Strong demand for powered, well-located sites | Strong for power-rich sites; old stock obsolete |
| ASX opportunity | Electrification, data centres | Plus materials processors, fabricators, industrial REITs | Owners of energy, land, resources and robots |
Scenario A is the default if nothing much changes in energy prices and processing capability: robots raise productivity, but Australia keeps importing most manufactured goods. Scenario B needs competitive power, industrial land, patient capital and policy that lasts longer than an electoral cycle — the conditions governments are now trying to create with production tax incentives, the green aluminium credit and the Whyalla rescue. Scenario C needs the humanoid forecasts to come true and would change far more than manufacturing. No probabilities are attached, because none could be defended.
The investment takeaways
- The labour-cost advantage of low-wage manufacturing is eroding, but slowly. Industrial robots are mature; humanoids are not. Plan on decades, not quarters.
- Australia's edge is selective. Heavy, bulky, energy- or resource-linked, perishable, customised and sovereign products — not phones.
- Automation squeezes the low-wage challengers most. Vietnam and India compete mainly on cheap labour — the cost robots remove — so in a highly automated world their edge over China, and over Australia, narrows fastest.
- Energy is the swing factor. Cheap, reliable industrial power — including factories running on their own solar and batteries — decides the close calls. Watch delivered industrial prices, not just wholesale.
- Own the picks and shovels. Electrical equipment, grid builders, plant engineers and powered industrial land benefit in all three scenarios.
- Check the price, not just the story. Several beneficiaries already trade at 30–60 times earnings. Others, like industrial REITs below asset value, are cheaper because they carry rate risk.
- Keep the core diversified and global. Thematic bets belong in a small satellite.
The Richer verdict
Could Australia's natural resources make it one of the great beneficiaries of advanced AI and robotics? The economics say possibly, and more plausibly than at any time since the 1970s. Widespread automation does erode the historical cost advantage of lower-wage manufacturing economies, and a country that owns world-scale reserves of iron ore, lithium, bauxite and rare earths, has land and sun to spare, and holds trillions of dollars in long-term savings, becomes relatively more competitive at turning its own minerals and food into finished goods.
But resources and cheap robots alone guarantee nothing. China can buy the same robots and is installing them faster than anyone. Commodity prices are set globally. Supplier networks take decades to build. And Australia's recent attempts to refine lithium and keep a steelworks running show that energy costs, processing know-how and capital discipline still decide outcomes. Australia would need competitive electricity, sophisticated technology, investment capital, industrial infrastructure and efficient supply chains — all at once.
For investors, the sensible stance is neither dismissal nor hype. Watch the businesses that win in most versions of the future — electrical infrastructure, grid construction, selected materials processors, automation technology and powered industrial property — and pay attention to what you are paying for them. The opportunity is extraordinary; so is the uncertainty. Invest Smarter. Live Richer.
Frequently asked questions
Could AI and robots really bring manufacturing back to Australia?
For some products, plausibly. Robots shrink the labour-cost gap that pushed manufacturing to Asia, which helps Australia most for heavy, bulky, energy- or resource-linked, perishable, customised and defence products. They help far less for phones, electronics and cars, where component ecosystems and scale matter more than labour. China can also use the same robots, so automation removes a handicap rather than handing Australia a lead.
Which Australian industries are most likely to benefit from robotics?
Steel and metal fabrication, aluminium and building products, food processing, and precision and defence engineering combine a local resource or customer advantage with robotics that already works today. Battery materials and rare earths have a resource advantage but face hard processing and energy challenges. Consumer electronics and cars face the biggest barriers.
Are there robotics stocks on the ASX?
Only small ones. FBR (robotic bricklaying) and AML3D (metal 3D printing) are listed but speculative; FBR had under $28,000 of cash at 30 June 2026 and has since raised capital. No humanoid robot maker is listed on the ASX. Larger ASX companies with exposure to automation and electrification include IPD Group, Southern Cross Electrical, GenusPlus, NRW, BlueScope, Lynas, Iluka, Goodman Group and Centuria Industrial REIT. This is general information, not a recommendation.
Will robots take Australian jobs?
Some jobs will change or disappear, particularly routine factory, warehouse and driving work, while demand for engineers, electricians and technicians rises. Jobs and Skills Australia found about 4% of workers have high exposure to automation from generative AI and far more have exposure to augmentation. Past waves of automation displaced occupations without causing permanent mass unemployment, but transitions can be long and hard for affected workers and towns.
Would automation mean lower immigration?
It could weaken the labour-shortage argument for high migration, particularly for routine trades. But immigration levels are set by political, social, demographic and humanitarian considerations as well as labour demand, and demand for skilled migrants in engineering, research and technology could rise. Net overseas migration was 292,100 in the year to March 2026; the Budget forecasts 245,000 in 2026–27.
What does robotics mean for industrial property?
More domestic manufacturing and data centres would increase demand for industrial land, especially sites with large, reliable power connections. National industrial vacancy was 4.6% in the September quarter 2026 (JLL). But automation also raises output per square metre, and older buildings without power capacity may become obsolete. Location and electricity will matter more than floor area.
Should I buy individual stocks or an ASX 200 ETF for this theme?
An ASX 200 ETF such as IOZ or A200 gives cheap, broad exposure, but it is dominated by banks and miners and holds little in robotics or advanced manufacturing. Individual stocks offer more targeted exposure with more risk. Many investors use a diversified core, including global shares, with a small satellite of thematic holdings. This is general information only; consider personal advice for your situation.
Sources
All figures are as at the dates shown and were checked on 26 October 2026. Share prices are closing prices on 23 October 2026. Forecasts and company claims are labelled as such; they are opinions at the time and change without notice. Some figures were read through secondary reports of primary documents, as noted.
- International Federation of Robotics, World Robotics 2026 — Executive Summary, 24 September 2026; and China press release.
- International Federation of Robotics, Robot density surges in Europe, Asia and Americas, 8 April 2026.
- Tesla, Q3 2026 earnings call, 21 October 2026, via The Motley Fool transcript.
- Figure AI, Ramping Figure 03 production, April 2026; The Robot Report, BMW deploys Figure 03, June 2026.
- Unitree and UBTech results, via BigGo Finance (Unitree, UBTech), August–October 2026.
- Agility Robotics S-4 filing, via GeekWire, 2026; Boston Dynamics, Metaplant Application Center, September 2026.
- Goldman Sachs humanoid forecast, via 24/7 Wall St; Bank of America, via Fortune, March 2026.
- Xiaomi Changping factory, via TrendForce, July 2024.
- GlobalData, autonomous haul trucks, July 2025; International Railway Journal, AutoHaul, March 2026.
- Australian Bureau of Statistics, National Accounts, June quarter 2026; Ai Group, Manufacturing in Australia 2025; Productivity Commission, Australia's manufacturing industry, 2021.
- Jobs and Skills Australia, Manufacturing industry profile (ABS Labour Force, February 2026).
- US Geological Survey, Mineral Commodity Summaries 2026: iron ore, lithium, bauxite, rare earths.
- Department of Industry, Science and Resources, Resources and Energy Quarterly, September 2026, via Market Index, October 2026.
- Australian Bureau of Statistics, Average Weekly Earnings, May 2026; National Bureau of Statistics of China, 2025 average wages, May 2026.
- National Statistics Office of Vietnam, Q1 2025 labour report, via Vietnam Investment Review, April 2025; India Ministry of Statistics, Annual Survey of Industries 2024–25, via Business Today, 30 September 2026.
- AEMO Quarterly Energy Dynamics Q3 2026, via The Energy and Pearls and Irritations, October 2026; Caixin, China power prices, August 2025.
- AEMO, 2026 Electricity Statement of Opportunities, 25 August 2026.
- CSIRO and AEMO, GenCost 2025–26 Final Report, 15 July 2026.
- Albemarle, Kemerton idling, February 2026; Mining.com, IGO sees no path forward for Kwinana, November 2025.
- Australian Taxation Office, Critical Minerals Production Tax Incentive.
- InDaily, Whyalla steelworks jobs cut, 14 September 2026; ABC News, Whyalla blast furnace, 19 October 2026.
- ABC News, Tomago support package, 12 August 2026; Bell Bay and the green aluminium credit, 28 July 2026.
- Jobs and Skills Australia, Our Gen AI Transition, August 2025; Reserve Bank of Australia, Technology investment and AI, November 2025; Productivity Commission, Harnessing data and digital technology, December 2025.
- Australian Bureau of Statistics, National, state and territory population, March 2026; Treasury, 2026 Intergenerational Report; UNSW, 2023 Intergenerational Report analysis.
- JLL industrial Q3 2026, via The Industrialist, 20 October 2026; CBRE, industrial vacancy 1H26.
- Perth Is OK, Contec 3D-printed home, July 2025; Kalkine, FBR Hadrian demonstration build, October 2026.
- Company FY26 results releases: IPD Group; BlueScope; Goodman; SGH; Centuria Industrial REIT; Sims.
- Company FY26 results releases: Codan; PWR; FBR; Southern Cross Electrical; Lynas; Iluka (half year); NRW; GenusPlus; AML3D.
- ASX, Seven Group Holdings name and code change to SGH, November 2024.
- BlackRock, iShares Core S&P/ASX 200 ETF; Betashares, Australia 200 ETF; State Street, S&P/ASX 200 index sector weights, 23 October 2026.
Keep reading
James Zhang writes richer.au's Property, Shares and Wealth coverage. He has invested for more than two decades across residential, commercial and development property and listed markets, through several Australian commodity and interest-rate cycles.
General information only. This article is general information, not personal financial, investment, taxation or legal advice, and doesn't account for your objectives, financial situation or needs. The scenarios, the washing-machine cost example, the migration paths, the core-and-satellite illustration and the valuation "reads" are the author's illustrations and judgements, not forecasts or recommendations. Company claims and forecasts quoted are those organisations' views at the dates shown. Share prices and financial figures are sourced and dated as shown and can change quickly. Past performance is not a reliable indicator of future performance. Richer Online Pty Ltd (ABN 62 159 604 949) does not hold an Australian Financial Services Licence and has no commercial relationship with any company named. Consider seeking advice from a licensed financial adviser before acting. See our Terms of Use or get in touch.
Get richer, one decision at a time
New articles as they land.
Property, shares, commodities and tax strategy — worked examples with real Australian figures and no product spruiking. One email when something new goes live.
No spam · unsubscribe any time