4100 · Asset allocation
Stay liquid. Stay Richer.
Most money management advice starts with the coffee. This one starts with the balance sheet. A practical framework for Australians who already have assets: how much cash to hold, when debt earns its place, why leverage and shares are an awkward pair, and how to make sure the market never gets to choose the day you sell.
The best investment is useless if you run out of cash
Almost every argument about money in Australia is an argument about selection. Which ETF. Which suburb. Which bank. Whether gold is a bubble. These are interesting questions, and they are the wrong place to start.
The investors who end up wealthy are rarely the ones with the best stock picks. They are the ones who were never forced to sell. They had cash when nobody else did, they were not carrying debt that ate them alive at 18 per cent, and when a genuine opportunity turned up they could act on it the same week. Everything below is built around that one idea.
This is a framework, not a formula. It is written for Australians who already have savings, an investment portfolio, a business or a property, and who want a sensible way to think about how much cash to hold, when borrowing makes sense, and where the line sits between using leverage and being used by it.
We also spend a full section attacking our own framework, because a rule you have not stress-tested is just a slogan.
- Why money management comes before selection
- Rule 1 — Kill debt that produces nothing
- Rule 2 — Cash is an option, not a return
- Rule 3 — Never deploy everything: the 75/50/25 framework
- Rule 4 — Debt can be productive: look at what backs it
- Rule 5 — Volatile assets and borrowed money
- Gold, silver and portfolio insurance
- The real enemy: forced selling
- What would you do with $500,000?
- Putting the system together
- What this framework gets wrong
Data updated 29 August 2026. Sources: RBA monetary policy decision, 11 August 2026; ABS Consumer Price Index, June quarter 2026; Canstar analysis of RBA credit card statistics, May 2026; CommSec margin loan rate effective 3 July 2026; Market Index; RBA Bulletin, December 2009. Full source list at the end of this article.
Why money management comes before selection
In the 1960s and 1970s there were three investors in Warren Buffett’s orbit, not two. Buffett, Charlie Munger, and a third man named Rick Guerin. Guerin was good enough that Buffett named him alongside Munger in his 1984 essay The Superinvestors of Graham-and-Doddsville. Almost nobody has heard of him now.
The reason is the 1973–74 bear market, in which US shares nearly halved. Guerin had borrowed on margin. When the calls came he had to raise cash, and the only liquid asset he had left was his Berkshire Hathaway stock. He sold it to Buffett at about US$40 a share. Berkshire A shares have since traded around US$700,000. Mohnish Pabrai, who heard the story from Buffett himself, reports the explanation he was given:
Charlie and I always knew we were going to be rich, but we were not in a hurry. And Rick was in a hurry.
Warren Buffett, as recounted by Mohnish PabraiGuerin’s analysis was not wrong. He owned the right asset — arguably the best asset of the twentieth century. What he did not own was a balance sheet that could survive two bad years, so the market picked his selling date and the next fifty years of compounding went to somebody else.
That is what money management actually means: arranging your finances so that the ordinary, entirely predictable event of being temporarily wrong does not turn into a permanent loss.
A strong balance sheet lets time work for you. A weak one lets the market choose when you sell.
Rule 1 — Kill debt that produces nothing
Debt is not good or bad in the abstract. Judge it by what the borrowed money bought and what that thing does for you afterwards. If the liability costs you money every month and the asset behind it neither produces cash nor improves your financial position, the arrangement is working against you.
The clearest example is a credit card. The average purchase rate on Australian cards is 18.61 per cent, and roughly $19.4 billion of card balances are still accruing interest. On a $20,000 balance that is about $3,720 a year, or $310 a month, in exchange for nothing at all.
Here is the part people underrate. Repaying that balance produces a guaranteed, risk-free, tax-free 18.61 per cent. There is no investment available to a retail investor in Australia that offers a certain 18.61 per cent. To match it in a savings account, on a marginal rate of 39 per cent including the Medicare levy, you would need a pre-tax rate of about 30.5 per cent.
Warren Buffett was asked about precisely this at the 2020 Berkshire Hathaway annual meeting, by a shareholder paying around 18 per cent on a card:
If I owed any money at 18%, the first thing I’d do with any money I had would be to pay it off. It’s going to be way better than any investment idea I’ve got… I don’t know how to make 18%.
Warren Buffett, Berkshire Hathaway annual meeting, 2020His number and the Australian average are, to within a rounding error, the same number.
Car finance is a milder version of the same problem. Borrow $50,000 over five years at 7 per cent and you will pay about $9,400 in interest, on top of whatever the vehicle loses in value over that period. The interest is not deductible unless the car is genuinely used to produce income.
None of which makes every consumer loan irrational. A 1.9 per cent dealer finance offer on a car you were buying anyway, taken so that you keep $50,000 liquid rather than draining your buffer, can be a perfectly sensible trade — you are buying optionality cheaply. The test is the arithmetic, not the category. Compare the after-tax cost of the debt with the after-tax return of whatever the money would otherwise do, and add something for the fact that a fixed repayment is a fixed obligation whether or not your income holds up.
The other half of Rule 1 is what happens to the repayment once the debt is gone. Redirect that $310 a month into investments and, at an assumed 7 per cent, it compounds to roughly $53,700 over ten years. The debt was not just costing 18.61 per cent. It was consuming the contribution that would have built the position.
First, anything above roughly 10 per cent — cards, buy-now-pay-later arrears, unsecured personal loans. The guaranteed return from repayment beats any realistic risk-adjusted alternative.
Second, build the cash buffer in Rule 2 before attacking cheaper debt. Being debt-free and broke is still fragile.
Third, mid-rate debt — car loans, secured personal loans — where the comparison against investing is genuinely close and depends on your marginal tax rate.
Last, deductible debt secured against income-producing assets, which may be worth keeping indefinitely. An offset account is usually the better tool here than extra repayments, because it keeps the money reachable.
Rule 2 — Cash is an option, not a return
Cash is usually judged on the wrong measure. People compare the interest rate on a savings account with the expected return on shares, conclude that cash loses, and go to 100 per cent invested. That comparison misses most of what cash actually does.
Cash is a call option on every future opportunity, and it never expires. It lets you meet an unexpected expense without selling anything. It lets you survive a redundancy, a bad quarter in the business, or a rate rise that adds $600 a month to a mortgage. It lets you buy when the person on the other side of the trade has to sell. And it lets you negotiate as a buyer who can settle, which in private transactions is worth real money.
Cash looks unproductive right up until the day an opportunity appears. Then liquidity is the asset.
The most disciplined practitioner of this idea publishes his balance sheet every quarter. Berkshire Hathaway held about US$360 billion in cash and US Treasury bills at 30 June 2026 — before anything else it owns. Buffett set out the reasoning long before the pile got that large:
We customarily keep at least $20 billion on hand so that we can both withstand unprecedented insurance losses… and quickly seize acquisition or investment opportunities, even during times of financial turmoil.
Warren Buffett, Berkshire Hathaway shareholder letter, 2010Note the two jobs in that one sentence: survive the bad thing, and be able to act while everyone else is still dealing with it. The second is the one people forget. On 23 September 2008, with credit markets shut, Berkshire put US$5 billion into Goldman Sachs on terms nobody negotiating from weakness could have got — 10 per cent perpetual preferred stock, plus warrants over another US$5 billion of ordinary shares at US$115. Berkshire was not smarter than everyone else that week. It was liquid.
The honest counterweight is that this option has a running cost, and in Australia today the cost is easy to measure. The best term deposit rate on Canstar's database was 5.55 per cent in early August 2026. Inflation was 3.8 per cent. So cash is producing a positive real return before tax — which is not always true — but interest is taxed at your full marginal rate.
Read that chart carefully, because it cuts both ways. On a 32 per cent marginal rate you are roughly breaking even in real terms. On 39 or 47 per cent you are slowly going backwards. Cash held for a decade at those rates is a real cost, not a rounding error — which is exactly why cash needs a job.
Two different buckets, doing two different things
Confusing these is where most cash allocation arguments go wrong.
Operating and emergency cash covers foreseeable and semi-foreseeable outgoings: the excess on the car insurance, the investment property that sits vacant for six weeks, three months of living costs if the income stops. ASIC's MoneySmart suggests three months of expenses as a starting target. This money is not an investment decision at all. It is insurance, and for anyone with a mortgage an offset account is usually the best home for it — every dollar sitting there saves you the mortgage rate, tax-free. At 5.52 per cent that is the equivalent of a savings account paying about 9.05 per cent before tax on a 39 per cent marginal rate.
Deployable investment cash is different. It is capital you have already decided to invest, that you have deliberately not invested yet. Everything in the framework below refers to this second bucket only. If you fold your emergency fund into your "cash allocation" you will conclude you are far more liquid than you are, and the first genuine emergency will make you a seller.
Waiting is a decision, not an absence of one
The big money is not in the buying and the selling, but in the waiting.
Charlie MungerThere is a common line that holding cash means "doing nothing" or "sitting on the sidelines". It is a poor description of what is happening. An investor holding cash has made an active trade: they have exchanged some expected return for liquidity, lower portfolio volatility, immunity from forced selling, and more purchasing power if prices fall.
That trade can be good or bad depending on the price. It is a bad trade if you hold cash for a decade waiting for a crash that arrives after the market has doubled. It is an excellent trade if you can buy quality assets from a distressed seller in month eighteen. What it is never is neutral. There is no position without a cost — being fully invested has one too, and it is paid on the day you have to sell something to fix a burst pipe.
Rule 3 — Never deploy everything
The third rule is the one that does the most work: whatever your view of markets, do not put yourself in a position where being temporarily wrong leaves you with no capacity to respond.
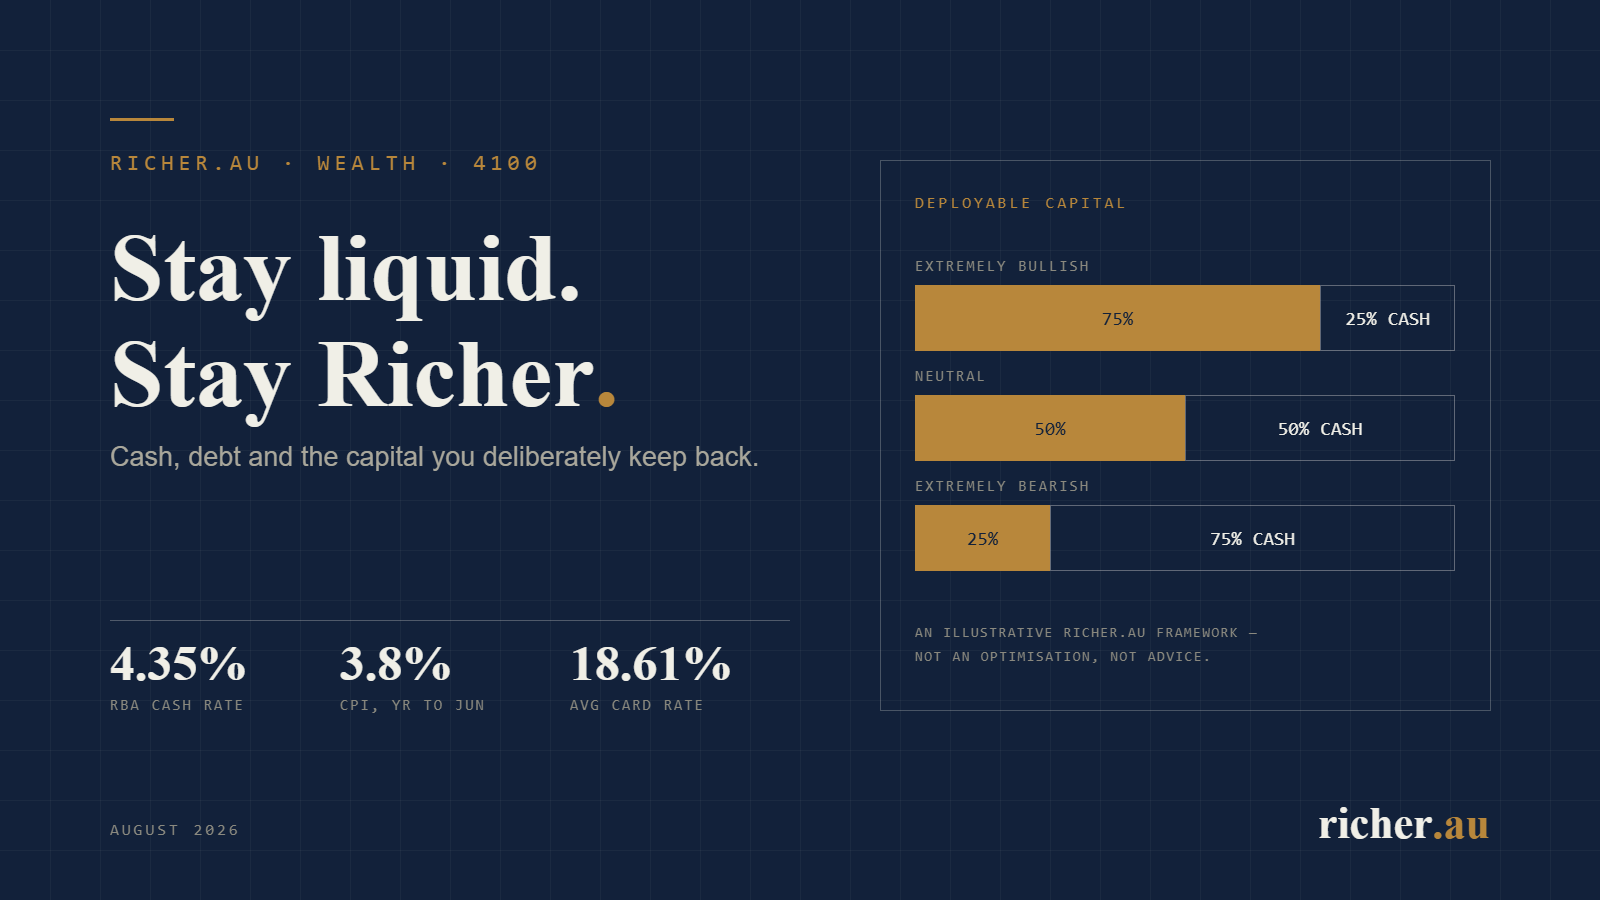
Below is the richer.au capital allocation framework. It applies to deployable investment cash, after emergency reserves and any commitment due in the next twelve months have been set aside. It is deliberately crude.
| Market view | Invested | Cash retained | What it assumes |
|---|---|---|---|
| Extremely bullish | Maximum ~75% | Minimum ~25% | Expected returns look unusually attractive — and you might still be wrong |
| Neutral / normal | ~50% | ~50% | No strong view; you are paid roughly what the risk deserves |
| Extremely bearish | ~25% | ~75% | Prices look poor — but markets can rise anyway, so you stay in the game |
These numbers are not derived from an optimisation. They are not backed by a study. They are a richer.au rule of thumb, and we set out below where the theory disagrees with them. What matters is the principle underneath:
Never make a forecast so confidently that you leave yourself no room to be wrong.
Even at maximum conviction, holding roughly a quarter back means a correction is an opportunity rather than an emergency, and that you can add to positions if they get cheaper. At maximum pessimism, staying roughly a quarter invested acknowledges something bearish investors routinely forget: markets frequently rise while the economic news is terrible. The Australian market bottomed in March 2009 with unemployment still climbing and every headline negative.
The worked example — $100,000 of deployable cash
Assume $100,000 available to invest, and ignore interest on cash and tax for a moment. Apply a 20 per cent move in either direction.
| Setting | Invested | Cash | After market +20% | After market −20% |
|---|---|---|---|---|
| Extremely bullish | $75,000 | $25,000 | $115,000 | $85,000 |
| Neutral | $50,000 | $50,000 | $110,000 | $90,000 |
| Extremely bearish | $25,000 | $75,000 | $105,000 | $95,000 |
| Fully invested | $100,000 | $0 | $120,000 | $80,000 |
Include interest and the picture shifts slightly in cash's favour. At 5 per cent, the bearish investor's $75,000 earns $3,750 over the year, the bullish investor's $25,000 earns $1,250. Not decisive, but not nothing.
The more interesting question is what happens next, because a 20 per cent fall is not the end of the story — it is the moment the cash has a job.
Suppose the market falls 20 per cent and then recovers to exactly where it started. Nothing has been earned by simply holding shares. But the investor who deployed capital at the lower level is meaningfully ahead.
Bearish setting. After the fall: $20,000 invested, $75,000 cash. Deploy $50,000 near the low, then the market rises 25 per cent to return to its starting level. Result: $87,500 invested plus $25,000 cash = $112,500.
Bullish setting. After the fall: $60,000 invested, $25,000 cash. Deploy $20,000. Result: $100,000 invested plus $5,000 cash = $105,000.
Fully invested. $100,000 to $80,000 and back to $100,000. Nothing gained.
The caveat that matters. This assumes you actually deploy near the low, which nobody identifies in advance and most people fail to do because that is precisely when it feels worst. And if the market had simply risen 20 per cent and stayed there, the ranking reverses completely: $120,000 fully invested, $115,000 bullish, $105,000 bearish. The framework buys flexibility. It does not buy foresight.
Which raises the obvious danger. A rule that moves you between 25 per cent and 75 per cent invested is only useful if the trigger is something more disciplined than how you feel about the news. Investors who swing between fully invested and fully cash are usually doing it on emotion, and emotion is reliably late in both directions — out after the fall, back in after the recovery. If you cannot write down in advance what would make you shift a bucket, you do not have a framework. You have a mood.
Rule 4 — Debt can be productive: look at what backs it
Nothing above is an argument against borrowing. It is an argument against borrowing badly. Debt earns its place when it funds an asset that generally satisfies five conditions:
- it produces reliable cash flow;
- that cash flow services most or all of the interest;
- there is a reasonable prospect of the asset holding or increasing its value;
- the price paid is sensible on today's numbers rather than tomorrow's hopes; and
- the financing is conservative enough that a bad year does not make you a seller.
Investment property with sustainable rent, commercial property with strong tenants, plant that a business actually uses, a carefully financed acquisition of an operating business — all can qualify. None qualifies automatically.
Leverage does not turn a bad investment into a good one. It magnifies whatever you already bought.
| Debt | What it funds | Cash flow from the asset | General characteristic |
|---|---|---|---|
| Credit card | Consumption | None | Almost always poor debt |
| Unsecured personal loan | Consumption or a depreciating item | None | Usually poor debt |
| Car loan | Depreciating vehicle | None, unless income-producing | Usually poor; occasionally defensible |
| Margin loan | Listed shares | Dividends, but daily price risk | High-risk leverage |
| Investment property loan | Income-producing property | Rent | Can be productive |
| Commercial property loan | Tenanted commercial asset | Rent, often on longer leases | Can be productive |
| Business acquisition debt | Operating business | Business earnings | Can be productive, and can go to zero |
Treat that table as a starting point, not a verdict. The category tells you very little on its own. A commercial property bought at a 4 per cent yield with 70 per cent debt and one tenant on a two-year lease is a far more dangerous position than a car loan. What decides the outcome is the quality of the underlying asset, the price paid, the interest rate, and how much leverage sits on top.
The same asset, two financing outcomes
Take a $1,000,000 property in both cases. The only differences are the amount borrowed and the income the asset actually produces.
| Case A — it services itself | Case B — you service it | |
|---|---|---|
| Asset price | $1,000,000 | $1,000,000 |
| Debt | $500,000 | $700,000 |
| Net income before interest | $60,000 | $25,000 |
| Interest at 6.0% / 5.77% | −$30,000 | −$40,390 |
| Cash flow before tax | +$30,000 | −$15,390 |
| Effect of a 1pp rate rise | +$25,000 | −$22,390 |
| Effect of 8 weeks' lost income | +$20,770 | −$19,240 |
A 6 per cent net yield on a $1,000,000 asset is not typical of metropolitan residential property in Australia; it is the kind of number you see in commercial, in regional markets, or in a business asset. That is the point. Case A is a position you can hold through almost anything. It pays you to own it, it absorbs a rate rise, and it absorbs a vacancy. The owner is never a forced seller, so the eventual capital outcome — good or bad — is theirs to collect.
Case B is a position that owns you. It consumes about $15,400 a year of outside income before tax, and a single rate rise or a vacant quarter turns that into more than $19,000. Every dollar of that is a dollar not going into the cash buffer. Resilience is being spent, quietly, month after month, in exchange for a capital gain that is a hope rather than a fact.
Negative cash flow has historically been partly offset by deducting the loss against other income. For established residential property purchased after 7:30pm AEST on 12 May 2026, that changes: from 1 July 2027 those losses are quarantined, deductible only against rental income and rental capital gains, and carried forward otherwise. Pre-cut-off holdings and eligible new builds are exempt. If Case B is your plan and the purchase is ahead of you, the after-tax hole is larger than it used to be. We covered the detail in negative gearing in Australia, 2026.
One more caution. Case A's positive cash flow does not, by itself, make it a good investment. A property yielding 6 per cent net in a town with a single employer and a declining population can still destroy capital faster than the rent accumulates. Cash flow buys you staying power. It does not buy you a good asset.
Rule 5 — Volatile assets and borrowed money
Borrowing against a good cash-flow asset is one thing. Borrowing against a portfolio that reprices every ninety seconds is another. The difference is not the leverage. It is the frequency at which someone else gets to mark your collateral.
Australian shares fall a long way, fairly often. The All Ordinaries fell 22 per cent over twelve months in the dot-com unwind and 54 per cent over sixteen months in the global financial crisis. In 2020 the ASX 200 was 35 per cent below its 20 February peak by 23 March, a month later, including a single-day fall of 9.7 per cent on 16 March — the largest in more than thirty years.
Now add debt. The arithmetic is unforgiving and worth doing slowly.
| Geared 50% | Unleveraged | |
|---|---|---|
| Your capital | $100,000 | $100,000 |
| Borrowed | $100,000 | $0 |
| Portfolio | $200,000 | $100,000 |
| After shares fall 30% | $140,000 | $70,000 |
| Debt still owing | $100,000 | $0 |
| Your equity | $40,000 | $70,000 |
| Change in your equity | −60% | −30% |
| Loan-to-value ratio | 71.4% | — |
The forced-selling mechanism is the part that does the damage. If the maximum loan-to-value ratio on that portfolio is 70 per cent, an LVR of 71.4 per cent is a margin call. Restoring it means selling about $6,700 of shares and using the proceeds to repay debt — at the low, at the worst prices of the cycle, with the decision made for you. Lenders may sell without notice if you do not respond.
This is not theoretical. Margin debt in Australia peaked near $38 billion in December 2007 and roughly halved to about $18 billion by September 2009. At the worst of the December 2008 quarter, lenders were making around ten margin calls a day per thousand clients. Average gearing rose from below 40 per cent to 50 per cent as collateral values collapsed, then fell to about 35 per cent as borrowers deleveraged — much of that deleveraging being sales made under duress.
Then there is the carry. A margin loan at 9.65 per cent against a portfolio yielding somewhere in the low-to-mid single digits is negative from day one. You are paying for the privilege of amplification, every month, whether or not the thesis works. The interest is generally deductible against investment income, which softens it, but a deduction is a discount on a cost, not a return.
Recovery arithmetic completes the picture. For the geared investor's $40,000 to get back to $100,000, the portfolio must climb from $140,000 to $200,000 — a rise of 42.9 per cent. For the unleveraged investor, $70,000 back to $100,000 needs the same 42.9 per cent. Leverage did not change the market move required. It changed whether you were still holding when it arrived.
July 2026: the cleanest demonstration in years
Leopold Aschenbrenner’s fund, Situational Awareness LP, illustrates every point in this section at once. Founded in 2024 by a former OpenAI researcher, it ran a concentrated long book in AI infrastructure and chip companies against shorts in software businesses it expected AI to damage. Through 30 June 2026 it was reported up 439 per cent net since inception, managing something in the order of US$20 billion. Gross exposure was reported as high as four times equity, with the top five positions making up more than three-quarters of the disclosed long book.
In July the AI infrastructure names fell. Several core holdings dropped between 27 and 54 per cent inside the month while the Nasdaq 100 fell about 10 per cent. At four times leverage, a 30 per cent fall in the long book is roughly the entire equity. The hedges moved the wrong way as well. On the morning of 30 July 2026, before the market opened, the whole public equity portfolio — longs and shorts together — was sold in a single block to Citadel to meet margin obligations.
Then the detail worth keeping. Once the forced seller was out of the way, the same positions repriced upward by roughly 18 to 28 per cent intraday. That discount had nothing to do with the underlying businesses. It was about who had to sell that morning — and it was collected by the buyer who did not.
Not blowing up is task number one and two. You have to get the timing right.
Leopold AschenbrennerThe uncomfortable part is that the thesis looks to have been right. An unleveraged private stake in Anthropic rose far enough that the fund was still up around 80 per cent for the calendar year in early August 2026. He was correct, and he was still sold out of the public book at the bottom of it. Aswath Damodaran’s post-mortem described combining a macro story with maximal leverage as creating “a time bomb”, and summed the lesson up as humble money beating smart money.
Borrowed money has no place in the investor’s tool kit.
Warren Buffett, Berkshire Hathaway shareholder letter, 2014Investors who use share leverage successfully tend to do the same handful of things: they run gearing well below the maximum, often 25 to 30 per cent rather than 50; they hold a separate cash reserve specifically to meet calls without selling; they gear into broad diversified exposure rather than concentrated positions; and they treat the buffer, not the maximum LVR, as the real limit. Instalment warrants and internally geared funds shift the margin-call risk off the investor's own balance sheet, at a cost.
The distinction throughout this article is not leverage versus no leverage. It is whether a bad month can force a decision you would not otherwise make.
Gold, silver and portfolio insurance
The five rules above deal with debt, cash and deployment. Defensive assets deserve a section of their own, because they do a job that neither productive assets nor cash quite covers — and because they are routinely oversold.
Gold sat at about A$6,410 an ounce in late August 2026, silver at roughly A$97. Gold's Australian-dollar price has gone from an average near A$2,005 in 2019 to about A$6,317 so far in 2026. That is a remarkable run, and it is exactly the wrong reason to buy.
The case for a modest allocation rests on function, not forecast. Precious metals may provide diversification against assets that all depend on the same credit cycle; an asset held outside the banking system when held physically; some protection through currency instability and geopolitical stress; and — critically for this article — liquidity that can be redeployed when everything else has fallen.
There is a specifically Australian angle worth understanding. The Australian dollar tends to weaken in global risk-off episodes, and gold is priced in US dollars. So Australian investors typically get two effects at once: the metal rises and the currency falls. That is a real diversification benefit, and it is also a reminder that a large part of what an Australian owns in gold is a bet against the Australian dollar.
It is not a reliable short-run inflation hedge. Erb and Harvey's work on gold found it functions as an inflation hedge over centuries rather than decades, shows essentially no correlation with unexpected inflation, and that variation in gold's real price — not inflation — drives most of its return. After the 1980 peak, gold returned roughly −5 per cent a year for the following decade.
It is not immune to a crisis. In the 2008–09 crisis gold fell between 15 and 25 per cent in US-dollar terms at points before recovering, and in March 2020 it was sold to raise cash like everything else. In a genuine liquidity event, investors sell what they can, not what they want to.
It produces nothing. No dividend, no rent, no earnings. Its entire return is the change in price, and it carries spreads, storage or custody costs along the way.
Silver is a different animal. Roughly half its demand is industrial, and it is far more volatile than gold — it tripled and then more than halved inside twelve months to 2026. Treat it as a higher-octane position, not as gold with a smaller price tag. We set out the numbers in silver as an investment in Australia.
Productive assets compound wealth. Cash preserves optionality. Precious metals, if you own them, insure against outcomes you hope never arrive.
Insurance is the right frame. Nobody expects their house insurance to be the engine of their wealth, and nobody cancels it because it did not pay out last year. Sized accordingly — a modest slice rather than a conviction bet — metals can sit in a portfolio without needing to be right about anything in particular.
The real enemy: forced selling
Every rule so far points at the same failure. Investors are rarely ruined by a bad idea. They are ruined by being unable to hold a reasonable idea long enough for it to work.
The mechanics are always some combination of the same six things: too much debt; too little cash; too much concentration in one asset or one employer; leverage against volatile collateral; short-term liabilities funding long-term assets; and no buffer for the ordinary accidents of life. Any one of them can be survived. Two or three at once, meeting a bad year, produces a sale at the worst available price.
What makes this the central theme rather than one risk among many is that forced selling converts a temporary loss into a permanent one. Markets recover; sold positions do not come back. The margin-called investor of March 2009 and the patient investor of March 2009 held identical views about the future. Only one of them was still there to collect.
What this looked like in Australia
Storm Financial is the version that happened to ordinary Australians. The model was double gearing: borrow against the family home, use the proceeds to take out a margin loan, and put the lot into index funds. Margin loans were arranged at loan-to-value ratios around 80 per cent with a 10 per cent buffer — more generous than the market standard. Of roughly 14,000 clients, about 3,000 were geared this way, and most were at or near retirement.
When markets fell through late 2008 the portfolios shrank and the loans did not. By early October 2008 around 600 clients were in margin-call territory at once. The Senate inquiry that followed found that many were not notified between September and December, and learned only afterwards that their portfolios had been sold at the lows — leaving them with no investments, a mortgage still over the house, and in some cases negative equity.
It was not only retail investors. On 26 February 2008, shares in ABC Learning — then one of the largest listed childcare operators in the world — fell as much as 70 per cent intraday to a low of $1.15. Its founder and his wife had sold 19 million shares between them; the disclosures gave no reason, and margin calls were the immediate and widely reported explanation. The company was in receivership by November. The people with the most information about that business did not get to choose their selling day either.
Never structure your finances so that being temporarily wrong can permanently destroy you.
What would you do with $500,000?
An illustration, not a recommendation. Take a hypothetical investor with $500,000 of liquid capital, an ordinary household budget, and a tax bill due within the year. Before any of the framework applies, two things come off the top: an emergency reserve and any commitment falling due in the next twelve months. Say $60,000 and $40,000 respectively — $100,000 in total, untouched in every scenario.
That leaves $400,000 of deployable investment cash. Applying the framework, and carving a small fixed insurance sleeve out of the invested portion:
| Position | Extremely bullish | Neutral | Extremely bearish |
|---|---|---|---|
| Emergency and near-term reserve | $100,000 | $100,000 | $100,000 |
| Growth assets | $280,000 | $180,000 | $80,000 |
| Insurance sleeve (metals) | $20,000 | $20,000 | $20,000 |
| Deployable cash held back | $100,000 | $200,000 | $300,000 |
| Total | $500,000 | $500,000 | $500,000 |
| Growth assets, share of total | 56% | 36% | 16% |
| Cash, share of total | 40% | 60% | 80% |
| Fall in total capital if growth assets drop 30% | −16.8% | −10.8% | −4.8% |
Two things should jump out. The first is how much protection the cash provides: a 30 per cent equity bear market costs the bullish version 16.8 per cent of total capital and the bearish version 4.8 per cent. Neither is pleasant. Neither is a crisis, and neither forces a sale.
The second is that even the bullish case holds 40 per cent of liquid capital in cash. Read literally, that is a very conservative portfolio by any conventional standard — and it is a fair criticism of the framework, which we take up below. Note also what this table excludes: superannuation, the family home, and any business the investor owns. For most Australians those dominate the balance sheet, and super in particular is usually invested aggressively whether or not you feel bullish.
Putting the system together
Five steps, in order. The order matters more than the numbers.
Clear expensive debt that funds nothing. It is the only guaranteed, tax-free return available, and it removes a fixed obligation from your balance sheet at the same time.
An emergency reserve first, in an offset account if you have a mortgage. Then a separate pool of deployable investment cash. Keep them mentally and practically distinct.
Commit more capital when expected returns look better, less when they look worse, and never all of it. Write down in advance what would change your setting, so the trigger is a number and not a headline.
Only against assets whose own cash flow services the debt, at a level that survives a rate rise and a vacancy. Be far more cautious where the collateral is marked to market daily.
Diversify across things that do not all fail together, and consider a modest defensive allocation. Size it as insurance, not as a position you need to be right about.
The objective is not to maximise the return on every dollar. It is to maximise long-term wealth subject to the constraint that you survive your own mistakes and still have capital when something exceptional appears. Those are different problems with different answers.
What this framework gets wrong
A rule you never argue with is a belief, not a framework. Here is the honest case against most of what you have just read.
Holding this much cash is expensive over a lifetime
On the long-run figures in the UBS Global Investment Returns Yearbook, US equities have returned about 6.6 per cent a year in real terms since 1900 and US bills about 0.5 per cent. A portfolio permanently split 50/50 between them lands somewhere near 3.6 per cent real. Over thirty years, $100,000 compounding at 6.6 per cent becomes roughly $680,000 in today's money; at 3.6 per cent, roughly $289,000. That gap is the price of the option, and it is enormous.
The defence is that the framework describes deployable cash, not a permanent portfolio setting, and that a "neutral" investor who never forms a view should probably not be sitting at 50 per cent cash for decades. But if you find yourself at 50 or 75 per cent cash year after year, you are not running a framework — you are running a permanent bond-like portfolio with an equity story attached. Be honest about which one you have.
The 25/50/75 numbers are not derived from anything
Standard portfolio theory says the optimal weight in a risky asset is roughly the expected excess return divided by the product of your risk aversion and the variance of returns. Put plausible Australian numbers in — an excess return over cash of about 5.5 per cent and volatility of about 17 per cent — and you get an optimal equity weight somewhere between roughly 40 and 95 per cent, depending entirely on how risk-averse you assume the investor is.
Note what that formula does not do. Moving from 75 per cent invested to 25 per cent requires you to believe the expected excess return has fallen to about a third of normal. That is a very strong forecast about the future, and the framework presents it as a mood — "extremely bearish". Theory says the swings should be much smaller than the framework allows, unless you genuinely have information about expected returns. Most people do not.
Timing is harder than the framework implies
The round-trip example earlier assumed the bearish investor deploys near the low. In practice the best and worst days in a market cluster together during the same panics, which makes it close to impossible to avoid one without missing the other. On US data since 1990, a dollar invested throughout grew to about $40; missing the 25 best days left about $8; missing the 25 worst days left about $240; missing both landed roughly back at buy-and-hold. You cannot have the third outcome. Separately, Vanguard's work has repeatedly found that investing a lump sum immediately beats phasing it in about two-thirds of the time, simply because markets rise more often than they fall.
Leverage is not the villain when it is managed
Plenty of Australian wealth has been built with borrowed money used carefully: modest gearing, long-dated debt, cash-flow-positive assets, and a reserve to meet shocks. The problem in this article is never leverage as such. It is leverage at a level where an ordinary market event forces a decision.
Positive cash flow is not a quality test
An asset that pays for itself is easier to hold. It is not necessarily worth holding. Plenty of high-yield assets are high-yield because the market has correctly identified that the income is not durable.
Metals can fail exactly when you need them
The insurance framing is useful but it is not a guarantee. Gold fell during parts of the 2008–09 crisis and was sold to raise cash in March 2020. There is no asset that reliably pays out in every kind of stress.
The biggest number is usually somewhere else entirely
For most Australians, the largest pool of investment capital is superannuation — and it is invested according to the fund's mandate, not your market view. AustralianSuper's Balanced option, the country's largest default, held 73.8 per cent in growth assets at 30 June 2026. An investor running 75 per cent cash on their outside-super money may still be heavily exposed once super and the family home are counted. Any allocation framework applied to one slice of a balance sheet in isolation will mislead you about the whole.
And liquidity needs are personal
A salaried employee with income protection and a stable job needs a different buffer from a business owner with lumpy receivables, a contractor between projects, or a retiree drawing down. There is no universal number, and anyone who gives you one without asking about your income is guessing.
The point of all of it
None of this is a system for beating the market. It is a system for still being in the market — with capital, on your own terms — after the years when most people are not.
Debt amplifies returns and it amplifies mistakes. Cash costs you something every year and buys you the ability to act in the years that matter. Leverage is a tool that works precisely as well as the asset underneath it. And the entire structure exists to serve one outcome: that nobody else ever gets to choose the day you sell.
Get that right and the investment selection question becomes much less fraught, because you can afford to be wrong for a while. Think Richer, and the first decision is not what to buy. It is what to keep back.
Frequently asked questions
How much cash should an investor keep?
There is no single right number, and it depends on how stable your income is, what your fixed commitments are and how quickly you could raise money elsewhere. As a starting point, ASIC's MoneySmart suggests an emergency fund of about three months of expenses; people with variable income, a mortgage and dependants commonly hold more. That is separate from any cash you are deliberately holding back to invest later, which is an allocation decision rather than a safety decision.
Is it bad to keep too much money in cash?
Over long periods, yes — the cost is real and compounds. On long-run US data since 1900, cash has returned roughly 0.5 per cent a year above inflation while equities have returned about 6.6 per cent. In Australia today the best term deposit rate of about 5.55 per cent falls to roughly 3.39 per cent after tax at a 39 per cent marginal rate, against inflation of 3.8 per cent — so a high-rate taxpayer is slowly going backwards in purchasing power. Cash is most defensible when it has a defined job and a rough timeframe.
What is the difference between good debt and bad debt?
The useful test is what the borrowed money bought and whether that thing produces cash. Debt funding consumption or a depreciating item, at a rate you cannot deduct, works against you every month. Debt funding an income-producing asset whose cash flow covers the interest can work for you. But the label follows the specifics — the asset's quality, the price paid, the interest rate and the amount of leverage — not the category.
Is borrowing money to invest in shares a good idea?
It is the highest-risk common form of leverage available to Australian retail investors, because the collateral is revalued daily and a fall can trigger a margin call. A 30 per cent fall in a portfolio geared 50 per cent cuts the investor's own equity by 60 per cent and can force sales at the bottom. At the peak of the December 2008 quarter, Australian lenders were making around ten margin calls a day per thousand clients. Some investors use share leverage successfully, generally at much lower gearing and with cash reserves set aside specifically to meet calls, but it is not a beginner's tool.
Should I pay off debt before investing?
For high-rate, non-deductible debt the arithmetic is usually decisive: repaying an 18.61 per cent credit card is a guaranteed, tax-free 18.61 per cent return, which no investment can promise. For low-rate deductible debt secured against an income-producing asset the comparison is much closer and depends on your marginal tax rate and the expected return on the alternative. Most people are best served clearing expensive debt, then building a cash buffer, then investing.
Is gold a good hedge against inflation?
Not reliably, over the horizons most people invest across. Research by Erb and Harvey found gold behaves as an inflation hedge over centuries rather than decades and shows essentially no relationship with unexpected inflation; after its 1980 peak it returned about −5 per cent a year for a decade. It has been a more consistent diversifier and crisis asset than an inflation instrument, and for Australians a gold holding is partly a position against the Australian dollar.
What does financial optionality mean?
It is the capacity to act. An investor with liquidity can meet an unexpected cost without selling, buy when others are forced sellers, take an opportunity that appears at short notice, and negotiate as someone who can settle. That capacity has value even when it is not being used, in the same way an unused insurance policy has value. The cost of holding it is the return you forgo in the meantime.
How much of my available cash should I invest?
That is a personal decision and depends on your objectives, timeframe and tolerance for loss — it is exactly the kind of question a licensed adviser exists for. The framework set out in this article is a richer.au illustration: never more than about three-quarters of deployable cash at maximum conviction, around half in normal conditions, and around a quarter when the outlook looks poor. It is a way of thinking about the constraint, not a recommended allocation for any particular person.
Data sources
- Reserve Bank of Australia, Statement by the Monetary Policy Board: Monetary Policy Decision, 11 August 2026 — cash rate target held at 4.35 per cent.
- Australian Bureau of Statistics, Consumer Price Index, Australia, June quarter 2026, released 29 July 2026 — headline CPI 3.8 per cent, trimmed mean 3.6 per cent.
- Reserve Bank of Australia, Lenders' Interest Rates — housing loans outstanding, owner-occupier 5.52 per cent and investor 5.77 per cent.
- Canstar, analysis of RBA credit card statistics, May 2026 (released 7 July 2026) — average purchase rate 18.61 per cent, $19.4 billion of balances accruing interest.
- Canstar, personal loan interest rates, August 2026 — market average 12.11 per cent.
- Canstar, best term deposit rates, 3 August 2026 — highest rate 5.55 per cent on a two-year term.
- CommSec, Margin Loan — variable rate 9.65 per cent per annum, effective 3 July 2026, and margin call mechanics.
- Australian Taxation Office, Tax rates — Australian residents, 2026–27; Medicare levy 2 per cent.
- ASIC MoneySmart, Save for an emergency fund — three months of expenses as a starting target.
- Reserve Bank of Australia, Recent Developments in Margin Lending in Australia, Bulletin, December 2009 — margin debt $38 billion to $18 billion, ten margin calls a day per thousand clients, gearing levels.
- Reserve Bank of Australia, Australian Securities Markets through the COVID-19 Pandemic, Bulletin, March 2022 — ASX 200 35 per cent below its 20 February 2020 peak by 23 March 2020.
- Market Index, History of the ASX — 54 per cent fall over 16 months in the global financial crisis, 22 per cent over 12 months in 2001–02, 25 per cent in a single day in October 1987.
- UBS, Global Investment Returns Yearbook 2026 (Dimson, Marsh and Staunton) — long-run real returns since 1900 of about 6.6 per cent for equities, 1.6 per cent for bonds and 0.5 per cent for bills.
- Claude B. Erb and Campbell R. Harvey, The Golden Dilemma, NBER Working Paper 18706 — gold's inflation-hedging properties over long horizons, and the post-1980 decade.
- World Gold Council, Gold prices swing as markets sell off, March 2020 — gold sold to raise cash; 15–25 per cent US-dollar pullbacks during 2008–09.
- The Perth Mint, metal prices, 28 August 2026 — gold A$6,410 and silver A$97 per ounce.
- AustralianSuper, pre-mixed investment options, as at 30 June 2026 — Balanced option 73.8 per cent growth assets.
- Gold Price Australia, gold price history in Australian dollars — annual averages, A$2,005 in 2019 and about A$6,317 year to date in 2026.
- Ben Carlson, Missing the best and worst days in the stock market, July 2026 — S&P 500 outcomes since 1990.
- Mohnish Pabrai’s account of the Rick Guerin story, as reported by 24/7 Wall St, May 2026. Guerin appears as Pacific Partners in Buffett’s 1984 essay The Superinvestors of Graham-and-Doddsville.
- CNBC, Warren Buffett cautions against carrying a credit card balance, 13 May 2020 — the 18% exchange at the Berkshire annual meeting.
- Berkshire Hathaway shareholder letters, 2010 (the minimum cash policy) and 2014 (“borrowed money has no place in the investor’s tool kit”).
- Berkshire Hathaway, Form 10-Q for the quarter ended 30 June 2026 — US$35.1 billion cash and cash equivalents plus US$324.9 billion of short-term US Treasury Bills (insurance and other).
- Goldman Sachs, Berkshire Hathaway invests US$5 billion in Goldman Sachs, 23 September 2008 — 10 per cent preferred stock and warrants at US$115.
- CNBC, AI investor Leopold Aschenbrenner forced to unwind all public stock positions after steep losses, 30 July 2026.
- SpotGamma, Anatomy of a margin call: how Situational Awareness LP unwound a $20 billion AI book in one trade — 439 per cent net through 30 June 2026, gross exposure to 4x, the 30 July block trade to Citadel and the 18–28 per cent intraday repricing.
- Aswath Damodaran, The Situational Awareness Fund Blow-up, August 2026 — the “time bomb” framing and “humble money beats smart money”.
- Senate Standing Committee on Corporations and Financial Services, Inquiry into financial products and services in Australia — chapter 3, The collapse of Storm Financial, 2009 — client numbers, LVRs and the margin-call notification failures.
- ABC News, Groves, wife sold 19 million ABC shares, 27 February 2008.
Keep reading
James Zhang is an Australian investor and business owner, and the founder of richer.au. He holds a Bachelor of Economics from the University of Sydney and an MBA majoring in Finance from the University of Technology Sydney, and has spent over twenty years investing in more than twenty properties across six Australian states and territories, alongside shares, ETFs, commodities and private businesses. More about James.
General information only. This article is general information and does not take your objectives, financial situation or needs into account. It is not personal financial, tax or investment advice, and nothing in it is a recommendation to buy or sell any product mentioned or to hold any particular allocation. The 25 / 50 / 75 capital allocation framework described here is an illustrative richer.au framework, not an optimisation, not an empirically proven allocation, and not a recommended position for any individual. Worked examples are simplified illustrations and ignore transaction costs and, unless stated, tax. Rates, prices and rules stated were current on 29 August 2026 and change without notice. Speak to a licensed financial adviser and a registered tax agent about your own circumstances.
Get richer, one decision at a time
New articles as they land.
Property, shares, commodities and tax strategy — worked examples with real Australian figures and no product spruiking. One email when something new goes live.
No spam · unsubscribe any time